Fig. 5.
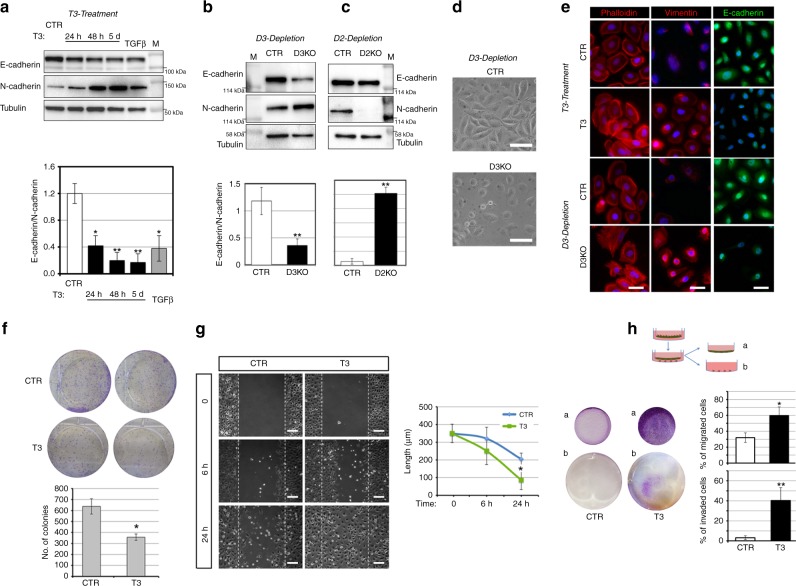
Thyroid hormone activation induces the epithelial–mesenchymal transition and migration and invasion ability of SCC cells. a SCC cells were treated with 30 nM T3 for different time points or with 5 ng/μl TGFβ for 48 h. Total protein lysates were used for western blot analysis of E-cadherin and N-cadherin expressions. Tubulin expression was measured as loading control. One representative immunoblot of seven is shown (top). Quantification of the E-cadherin/N-cadherin ratio in the western blot is represented by histograms. b Western blot analysis of E-cadherin and N-cadherin expressions performed as indicated in a in SCC-CTR and SCC-D3KO cells. c Western blot analysis of E-cadherin and N-cadherin expressions in SCC-CTR and SCC-D2KO cells. d Representative phase contrast of CTR and D3KO cells. Scale bars represent 50 μm. e Phalloidin (red), Vimentin (red), and E-cadherin staining (green) of untreated and T3-treated SCC cells, SCC-CTR cells, and SCC-D3KO cells. One representative experiment of 5 is shown. Scale bars represent 50 μm. *P < 0.05, **P < 0.01. f Cell proliferation was assessed by colony assay of SCC cells treated or not with 30 nM T3 (top). The number of colonies formed 8 days after plating shown by scale bars (Bottom). One representative assay of five is shown. g Wound scratch assay was performed in SCC cells after treatment with T3 (30 nM) for 0, 6, and 24 h. Cell migration was measured as described in the “Methods” section. Scale bars represent 200 μm. h Invasion assay performed on SCC cells treated or not with 30 nM T3 for 5 days. (b) Represents cells that invaded on the receiver plate and the area covered by invaded cells is indicated. The percentage of cells that migrated and invaded are represented by histograms.

