Figure 2.

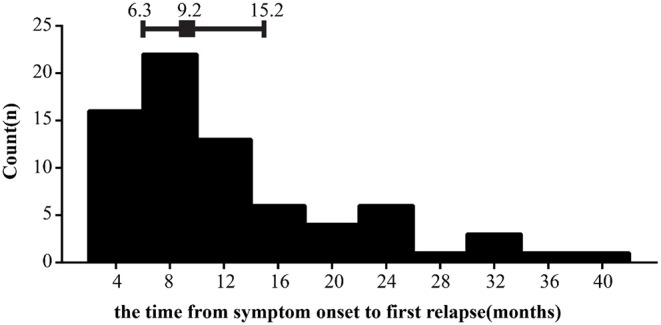
Distributions of the interval time from symptom onset to first relapse. Error bars show median surrounded by 25th and 75th percentiles.

Distributions of the interval time from symptom onset to first relapse. Error bars show median surrounded by 25th and 75th percentiles.