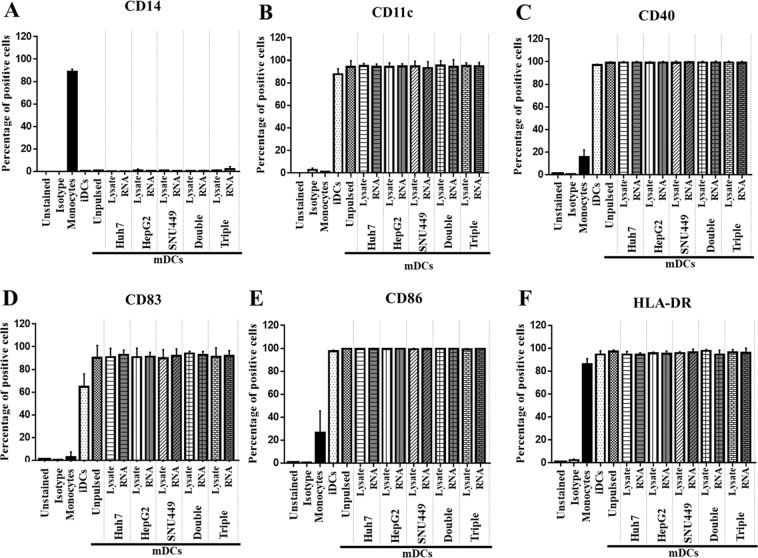
Figure 1.
Expression levels of monocyte markers, maturation markers, and co-stimulatory molecules on monocytes, iDCs, and mDCs. Monocytes were retrieved from adherent PBMCs. iDCs were induced from monocytes by supplementation with GM-CSF and IL4 for 6 days. mDCs were further driven from iDCs with TNFa and IFNg for 2 days. During their maturation, DCs were pulsed with total cell lysate or RNA prepared from single, double, or triple HCC cell lines. Monocytes, iDCs, and mDCs were stained with indicated antibodies and then evaluated for fluorescent signals by flow cytometry. The plotted bar graph indicates percentages of positive cells (mean ± SEM) that exhibited monocyte markers, CD14 (A); DC markers, CD11c (B); T-cell costimulatory molecules, CD40 (C), and CD86 (E); and, maturation markers, CD83 (D) and HLA-DR (F).

