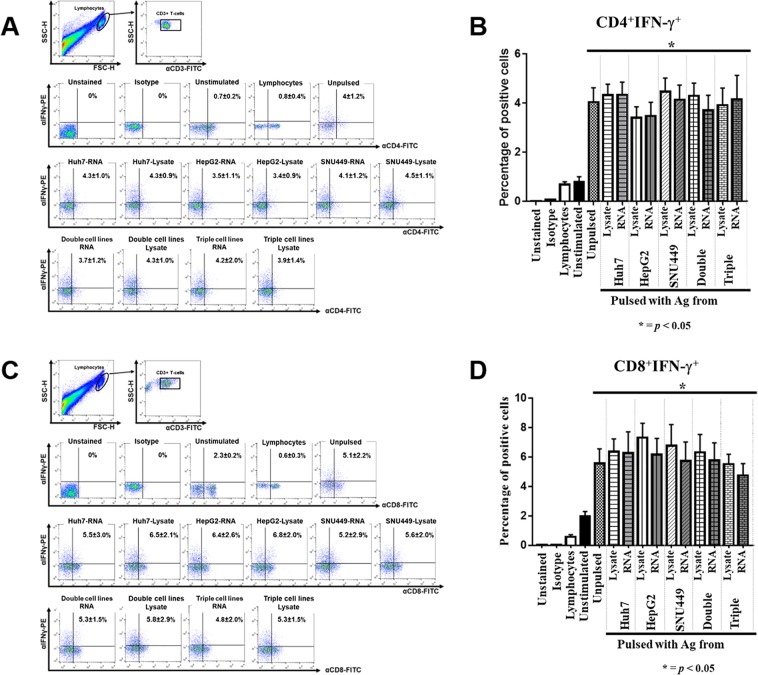
Figure 3.
IFN-γ production profile of helper T-cells and cytotoxic T-cells in effector T-lymphocytes. After activation and propagation for 10 days, effector T-lymphocytes were treated with PMA and ionomycin for 24 hours, and then investigated for intracellular IFNγ production by flow cytometry. Effector T-cells were primarily gated by CD3+ cells, and then the IFNγ production profile of CD4 + helper T-cells (A) and CD8+ cytotoxic T-cells (C) was further analyzed. Data of CD4+ IFNγ+ (B) and CD8+ IFNγ+ (D) populations are shown as mean ± SEM, which were calculated from three independent experiments. (*p < 0.05 compared with non-adhering PBMCs. Data analyzed by one-way ANOVA with Tukey’s correction).

