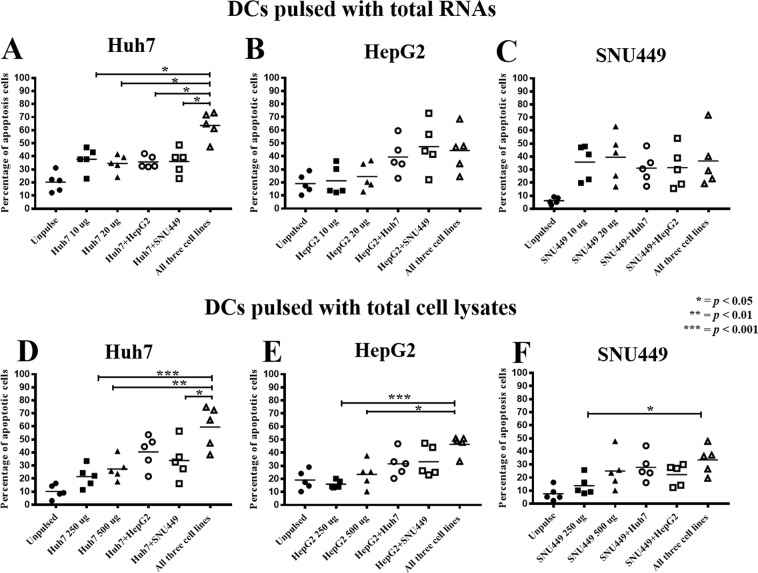
Figure 4.
Comparison of cytotoxic activity of effector cells when activated with DCs pulsed with different sources of antigens. Data presented as scatter plots of percentages of target cell apoptosis at the most effective E:T ratio, which was 10:1. Data show percentages (mean ± SEM) of target cell apoptosis that were calculated from three independent experiments. (*p < 0.05, **p < 0.01, ***p < 0.001 analyzed by one-way ANOVA with Tukey’s correction).

