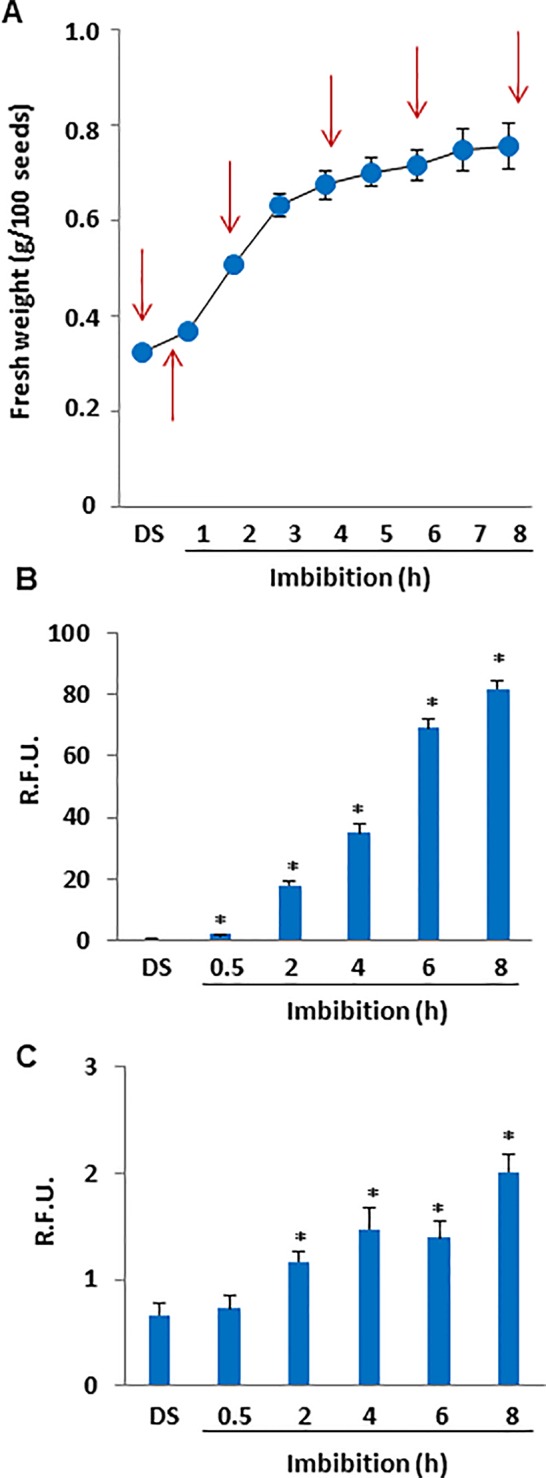
Figure 1.

(A) Imbibition curve of M. truncatula seeds. Arrows indicate the selected time points (0, 0.5, 2, 4, 6, and 8 h) for analyses. (B) ROS levels measured in dry and imbibed seeds using the DCF-DA fluorescent dye. (C) N2O3 levels measured in dry and imbibed seeds using the DAF2-DA fluorescent dye. Values are expressed as mean ± SD of three independent replicates with 20 seeds for each replicate. Asterisks indicate statistically significant differences determined using Student’s t-test (P < 0.01). N2O3, dinitrogen trioxide; R.F.U., relative fluorescence unit; ROS, reactive oxygen species; DCF-DA, dye 2′,7′-dichlorofluorescein diacetate; DAF2-DA, diaminofluorescein diacetate.
