Fig. 2.

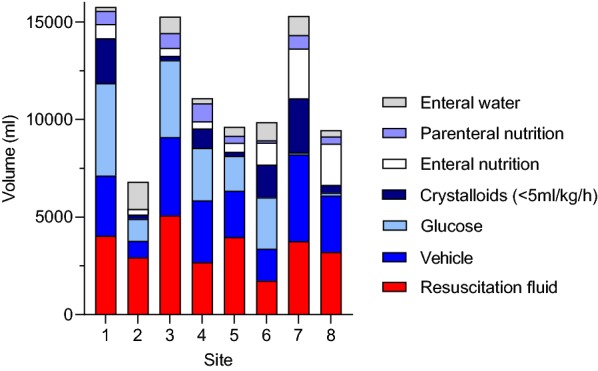
Volume and type of fluids per site day 1–5. Data for type of fluid are presented as fraction of median volume. N number of patients

Volume and type of fluids per site day 1–5. Data for type of fluid are presented as fraction of median volume. N number of patients