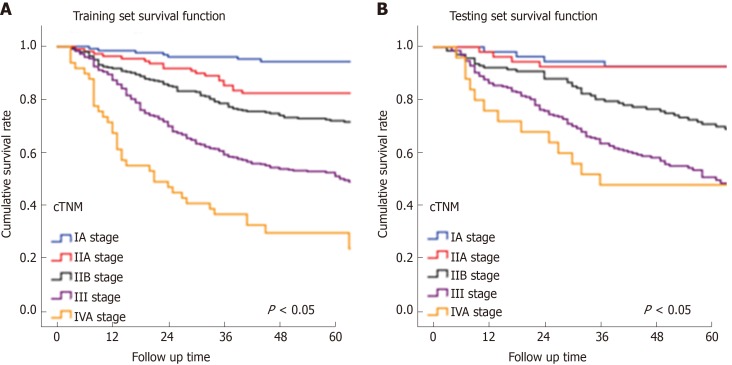
Figure 4.
Survival curves of the clinical TNM staging. A: The discrimination between the survival curves of each stage of the clinical TNM (cTNM) system in the training set was good (P < 0.05). B: There was no significant difference in the survival curves between the cTNM stages I and II A (P = 0.935), and between stages III and IVA (P = 0.355). cTNM: Clinical TNM.

