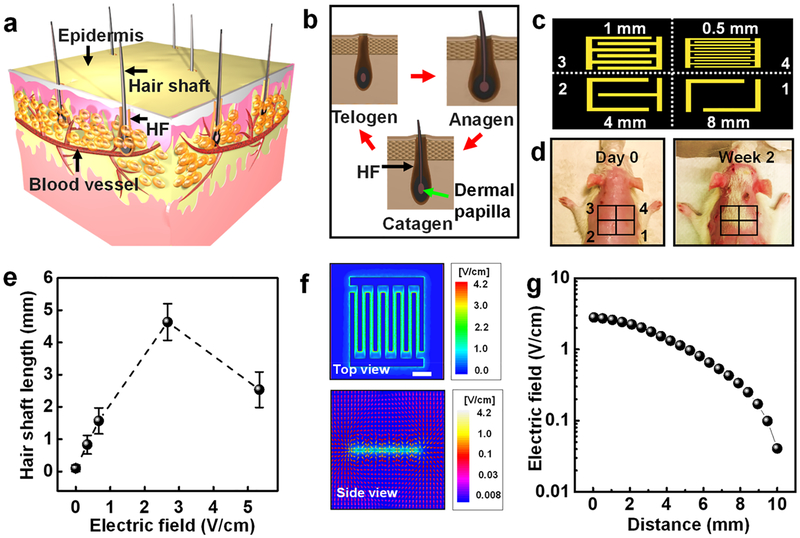
Figure 3.
Hair regeneration effect of SD rats under the stimulation of the m-ESD. (a) Schematic illustration of HFs in skin. (b) Histomorphology schematic of the hair cycle including anagen, catagen, and telogen stages. (c) Schematic diagram of a series of interdigitated electrodes (1–4) with different gap widths. (d) Optical images of the rat with removed hair (day 0, left) and after 2-week treatment (right). (e) EF-stimulated hair shaft length as a function of the EF intensity (n = 6). (f) Top and side views of EF distribution (gap width is 1 mm) simulated by ±150 mV. (g) EF strength at different distances perpendicular to the plane of the interdigitated electrode (gap = 1 mm). All data in (e) are presented as mean ± s.d.

