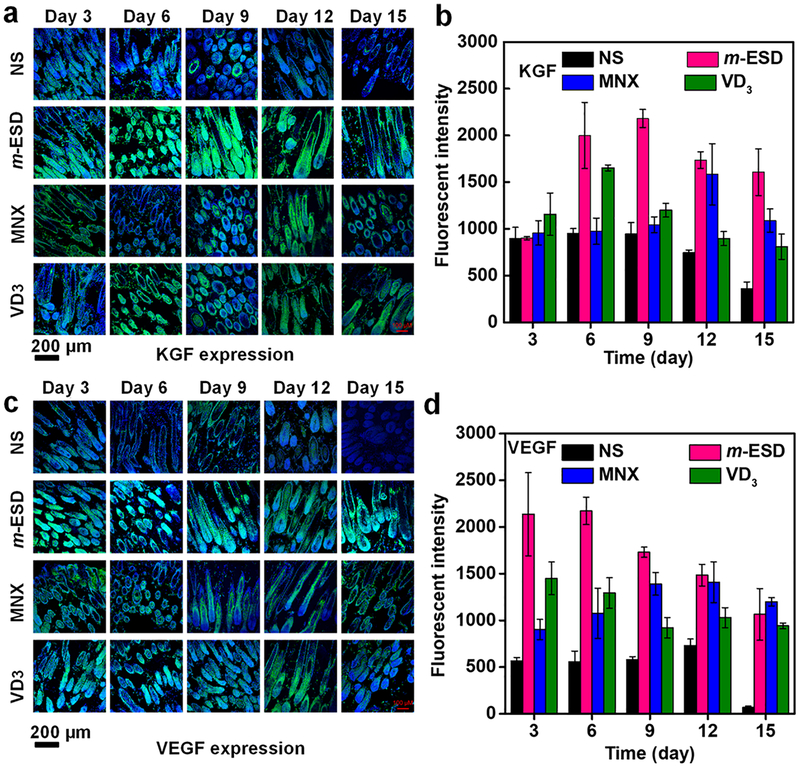
Figure 6.
Growth factor expression in skin of nude mice under stimulation of m-ESDs. (a) Confocal imaging of the KGF expression as a function of time for different treatments. (b) Fluorescence intensity of KGF quantitative expression (n = 3). (c) Confocal imaging of the VEGF expression as a function of time for different treatments. (d) Fluorescence intensity of VEGF quantitative expression (n = 3). All data in (b) and (d) are presented as mean ± s.d.

