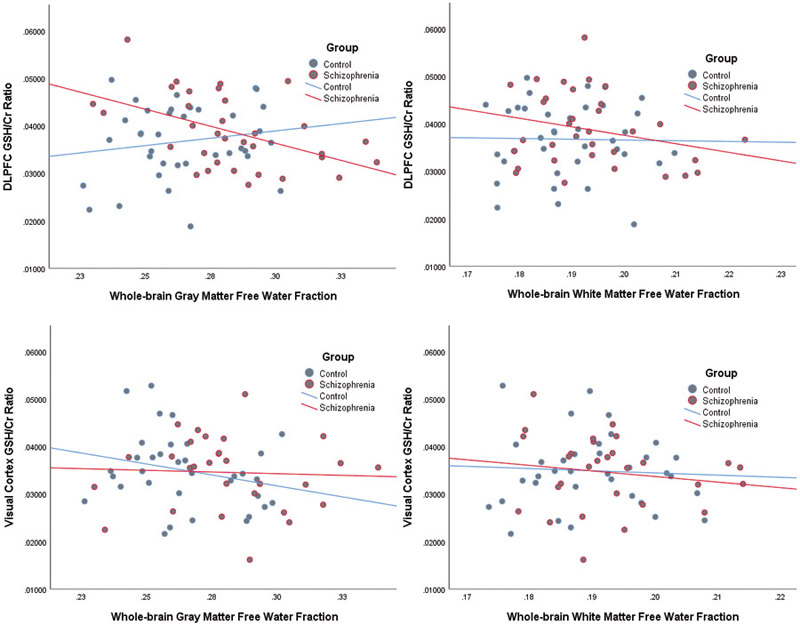
Figure 2:

Relationships between glutathione (GSH) and free water measures were tested with Pearson r correlations. The top two panels present the relationship between gray (top left) and white (top right) free water and DLPFC GSH values. The bottom two panels present the relationship between gray (bottom left) and white (bottom right) free water and visual cortex GSH values. A significant inverse relationship was identified between GSH in the hypothesized DLPFC region and gray matter free water in schizophrenia patients (p=0.004). Additionally, the relationship between GSH and gray matter free water was stronger in the schizophrenia group compared to the control group (Fisher’s r-to-z, p=.005).
