
Figure 3:
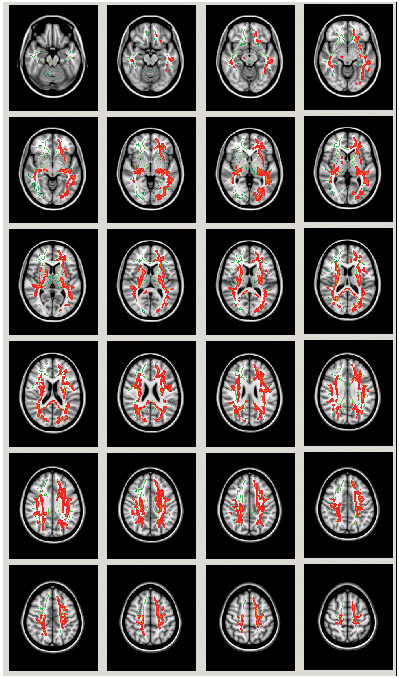
Tract-based spatial statistics voxel-wise analysis of free water group differences presented in axial slices. Regions in red depict areas in which first episode schizophrenia patients showed significantly higher free water compared to controls. Clusters presented survive correction for multiple comparisons (p<.05).