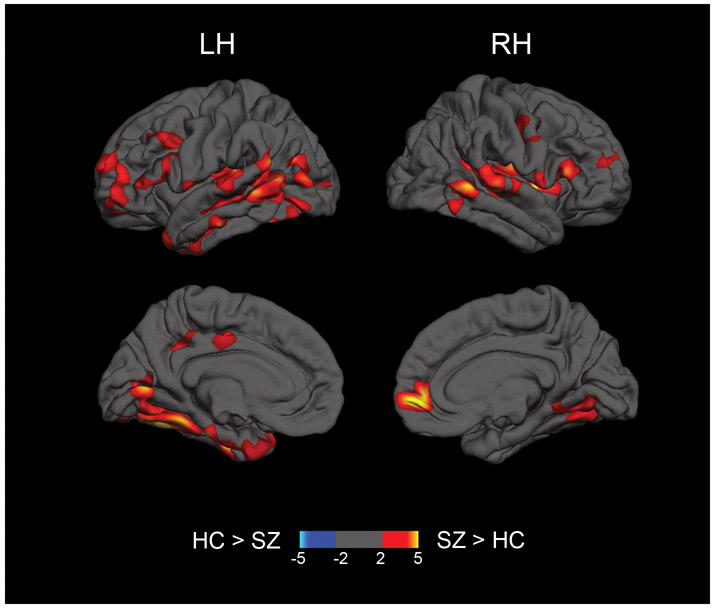
Figure 4:
Representation of regional group differences in free water in the cortical gray matter. Free water was projected on the cortical surface and tested for group differences using Freesurfer tools. Hot colors represent clusters in which first episode schizophrenia patients (SZ) show significantly higher free water compared to controls (HC) in the left (LH) and right (RH) hemispheres. Clusters presented survive correction for multiple comparisons (p<.05). The color scale ranges from 2 to 5, representing −log10(p-value) of p=.01 to .00001.

