
Figure 3.
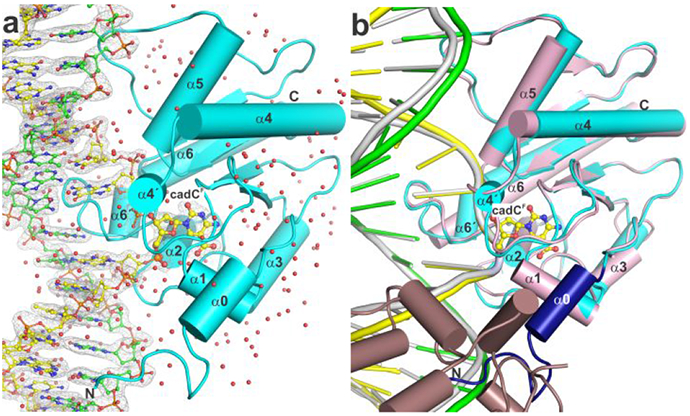
High-resolution structure of TDG bound to G·caC DNA. (a) Crystal structure of TDG82-308 bound to DNA with cadCF in its active site (1.55 Å; PDB ID 6U17). TDG82-308 is cyan, water molecules are red spheres, the target DNA strand (with cadCF) is yellow and the complementary strand green (with N, blue; O, red; P, orange). The 2Fo–Fc electron density map, contoured at 1.0σ, is shown for DNA. (b) Alignment of our new structure and a previous structure of TDG111-308 bound to cadCF DNA (3.01 Å; PDB ID 3UOB). Coloring for the new structure is the same except that residues 107-122 are dark blue. The previous structure exhibited 2:1 binding, one TDG subunit (pink) bound at a G·caC site and the adjacent subunit (dirty violet) at a nonspecific site.