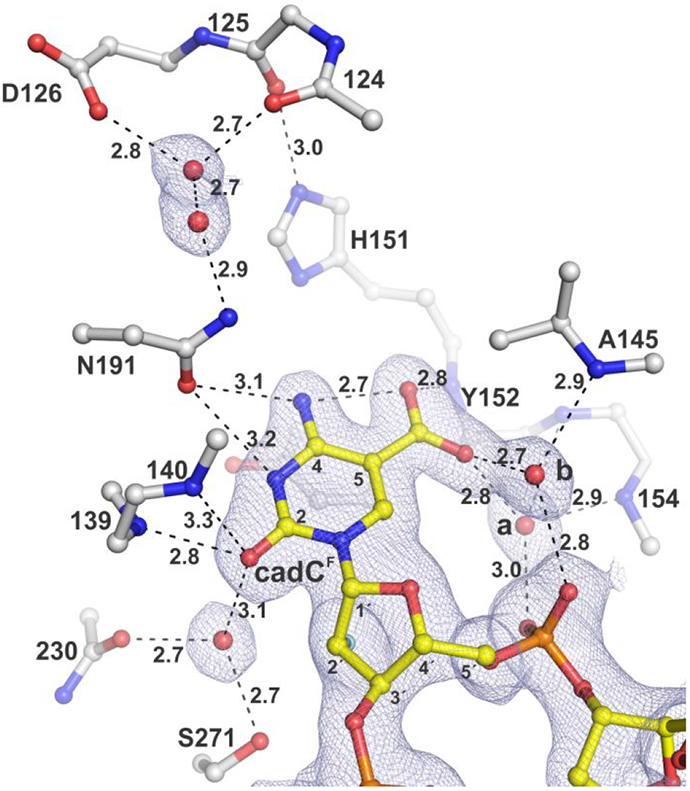
Figure 4.

Structure of TDG82-308 bound to DNA with cadCF flipped into the active site. The 2Fo–Fc electron density map, contoured at 1.0σ, is shown for cadCF DNA and water molecules. Dashed lines represent hydrogen bonds, with interatomic distances (Å) shown. Water molecules contacting the carboxylate of cadC are labeled (a, b). The 2′-F substituent, colored cyan, is partially obscured by C2′, though its electron density is visible.
