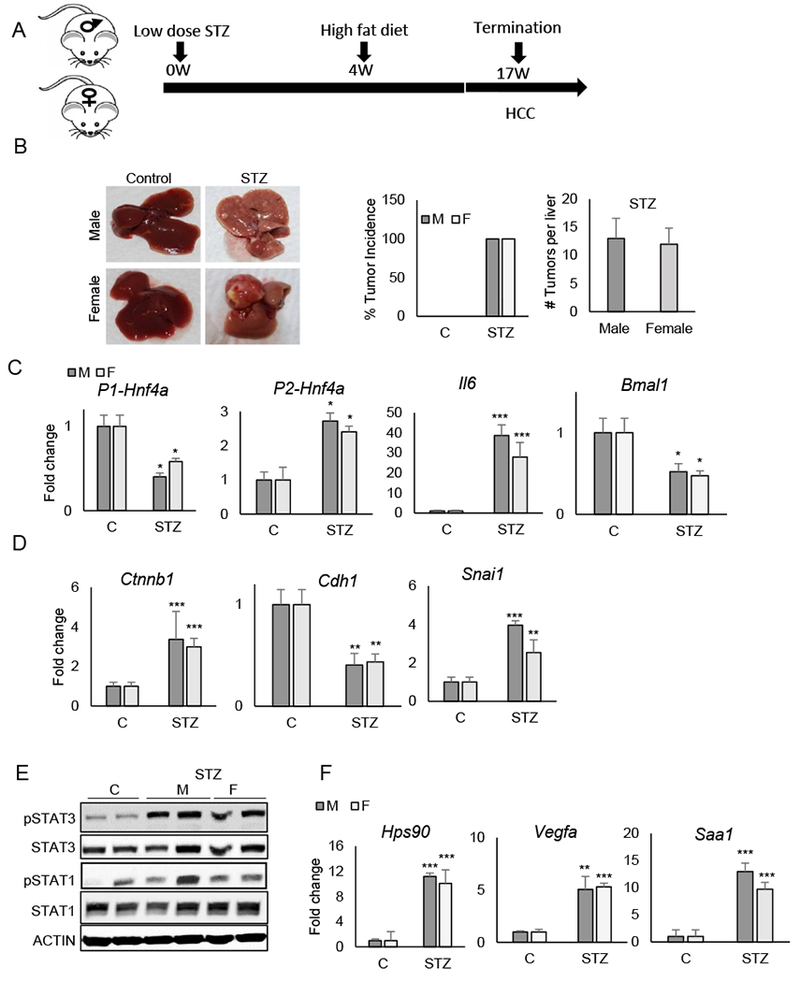
Figure 6. The accelerated model of fatty liver-induced HCC (STAM model) results in HCC in male and female mice.

A. Timeline of experimentation. B. Livers of control- and STZ-treated STAM mice at 17 weeks of age (left). Percent tumor incidence and number of tumors per liver in control and STAM mice (right). C-D. RT-PCR reveals mRNA abundance of P1-Hnf4a, P2-Hnf4a, Il6 and Bmal1 (C) and genes affecting epithelial-mesenchymal transition in control vs. STAM mice (D). E. Western blot of liver lysates from mice treated with STZ or Vehicle (C) using antibodies to phosphorylated STAT1 and STAT3, total STAT proteins, and ACTIN. F. RT-PCR reveals mRNA levels of STAT3 target genes (N=4-5). Two-way ANOVA, Sidak’s multiple comparisons test, *P < 0.03, **P < 0.005, ***P < 0.0005, ****P < 0.0001.
