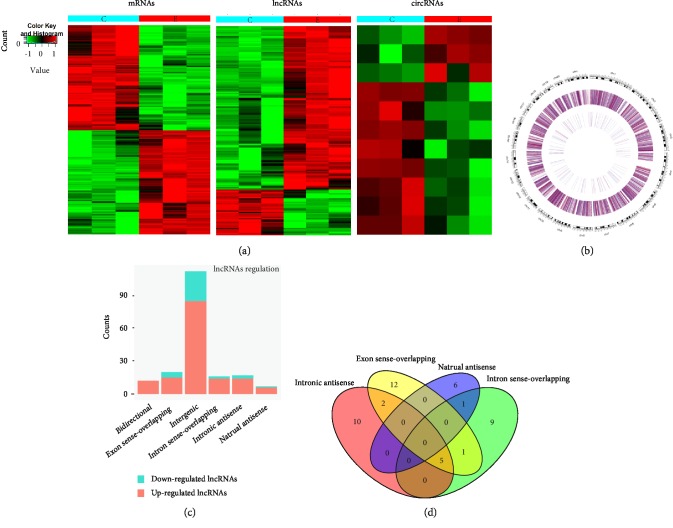
Figure 2.
Heat maps showing expression profiles of lncRNAs, circRNAs, mRNAs, and identification of differentially expressed lncRNAs in the liver tissues of the control and BDDLT group. (a) Heat maps show normalized expression values of significantly changed lncRNAs, circRNAs, and mRNAs with a fold change ≥ 2.0, p < 0.05, and FDR < 0.05. C: control group tissues. B: BDDLT group tissues. (b) Circos images show the distribution of lncRNA in rat chromosomes, the outermost layer of Circos is the distribution of rat chromosomes, the black and white bands are the cytobands of chromosomes, the middle two circles are the up-down distribution of lncRNA, the intermediate outer ring represents the difference of all detected lncRNAs in the chip, and the intermediate inner ring represents the difference of different lncRNAs (fold change is greater than 2.0, p < 0.05). (c) Types and counts of differentially regulated lncRNAs detected by microarray (fold change ≥ 2.0, p < 0.05, and FDR < 0.05). The lncRNAs are classified into 6 types according to the relationship and genomic loci with their associated coding genes. (d) The Venn diagram represents the overlapping of relationships and the numbers indicate the lncRNA counts.

