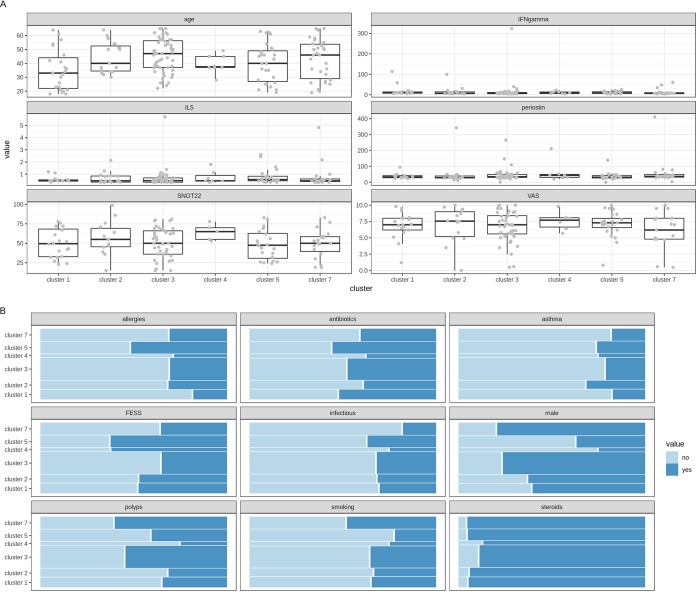
FIG 5.
Associations of numerical (A) and categorical (B) microbiome covariates with microbiome-based subject clusters. (A) Box plot visualization of age, IFN-γ concentration, IL-5 concentration, periostin concentration, and 22-item Sino-Nasal Outcome Test (SNOT-22) and Visual Analog Scale (VAS) scores for the six microbiome clusters. (B) Mosaic plot showing the association of the categorical variables with the microbiome clusters. The surface of each colored area is proportional to the number of subjects that it represents. Significance tests of associations of the covariates with the microbiome were performed using the adonis model.

