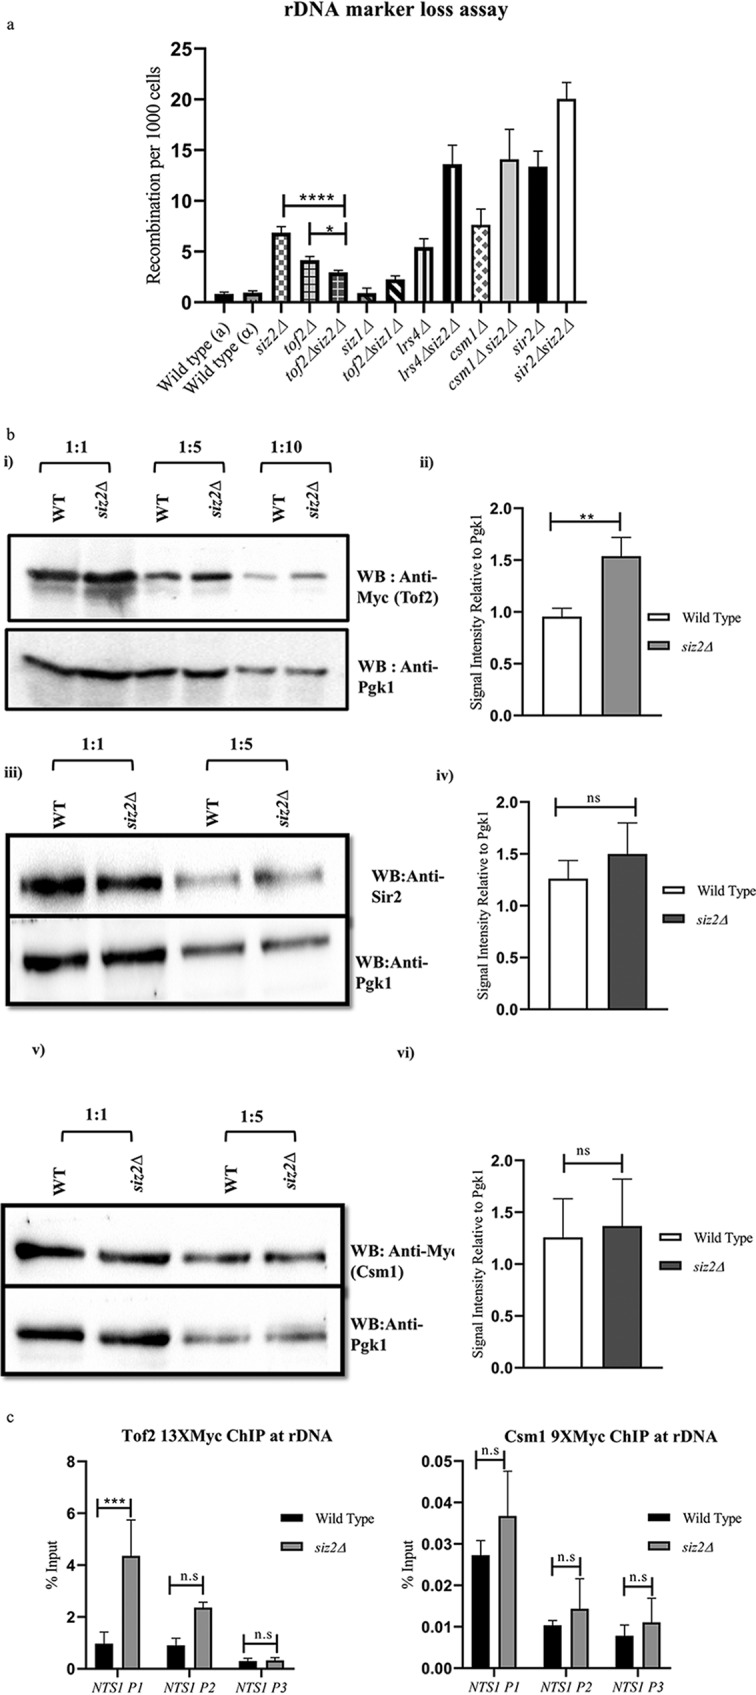
FIG 2.

Siz2 controls rDNA recombination through Tof2. (a) Recombination frequency per 1,000 cells was measured for the following: wild-type a (KRY 486), wild-type α (KRY 2129), siz2Δ (KRY 1821), csm1Δ (KRY 487), lrs4Δ (KRY 488), tof2Δ (KRY 489), sir2Δ (KRY 1542), sir2Δ siz2Δ (KRY 1906), csm1Δ siz2Δ (KRY 1813), lrs4Δ siz2Δ (KRY 1816), tof2Δ siz2Δ (KRY 1819), siz1Δ (KRY 2108), and siz1Δ tof2Δ (KRY 2107) strains. Strains were grown in selective medium, plated onto SC-Ade plates containing minimal adenine, and incubated for 2 to 3 days. (b) Total protein was extracted from indicated strains; undiluted extract and 5-fold and 10-fold dilutions of the extracts were separated by SDS-PAGE; and Western blotting assays were performed with antibodies to Myc epitope to detect Tof2 and Csm1 or antibodies to Sir2. All blots were probed with antibodies to Pgk1 to confirm equal loading. (i) Western blot (WB) assay to detect Tof2 in wild-type (WT) and siz2Δ strains containing Tof2-Myc (KRY 2131 and KRY 2132). (ii) Quantification of Tof2 in KRY 2131 and KRY 2132 (n = 4); n refers to the number of Western blot assays performed using extracts from 4 independent colonies. (iii) Western blot assay to detect Sir2 in wild-type and siz2Δ (KRY 1923 and KRY 1924) strains. (iv) Quantification of Sir2 in KRY 1923 and KRY 1924 (n = 3); n refers to the number of Western blot assays performed using extracts from 3 independent colonies. (v) Western blot assay to detect Csm1 in wild-type and siz2Δ strains containing Csm1-Myc (KRY 1800 and KRY 1898). (vi) Quantification of Csm1 in KRY 1800 and KRY 1898 (n = 3); n refers to the number of Western blot assays performed using extracts from 3 independent colonies. (c) Wild-type and siz2Δ strains containing either 13×Myc-tagged Tof2 (KRY 1923 and KRY 1924, respectively) or 9×Myc-tagged Csm1 (KRY 1800 and KRY 1898) were used to perform ChIP with anti-Myc, and the level of enrichment at regions within the NTS1 including the RFB (NTS1 P1) was calculated and plotted as percent input. Graph represents an average from five experiments, and error bars represent SEM. ns, P > 0.05; *, P ≤ 0.05; **, P ≤ 0.01; ***, P ≤ 0.001; ****, P ≤ 0.0001.
