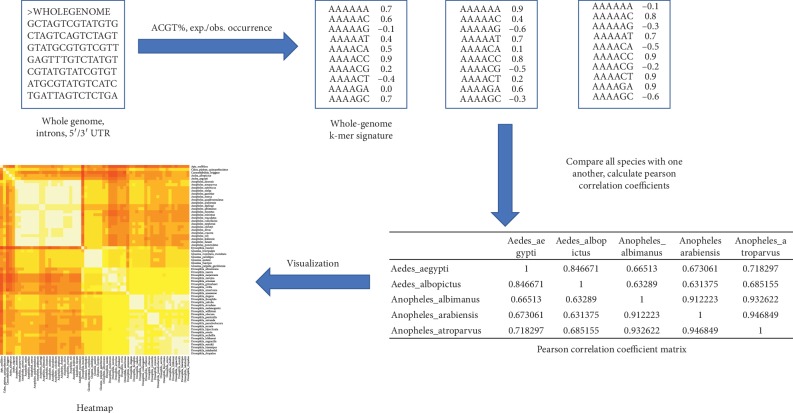
Figure 1.
Flowchart depicting the algorithm. First, the whole-genome sequences or subgenomic region of interest for all species are analyzed, and the WGKS is produced. This is a list of all possible k-mers together with their normalized score values. These WGKSs are compared in an all-versus-all manner, using the Pearson correlation coefficient. This produces a CC matrix, which is then visualized in a heatmap, depicting species relationships.

