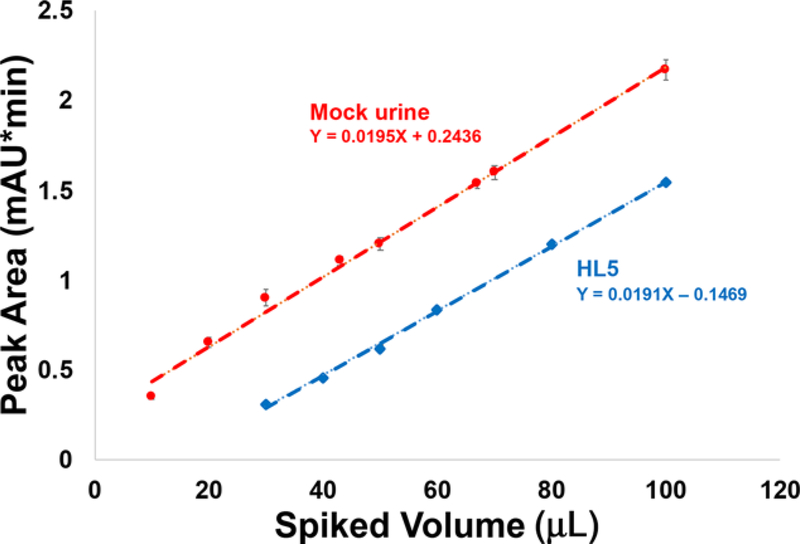
Figure 6.
Analytical response curves for separations of mixtures of 100 μL of the test matrices (simulated urine and HL5 media) and the designated volumes of DC-isolated EVs. Separations were performed with a mobile phase flow rate of 0.5 mL/min, 20 μL aliquot injections, and a 20 min gradient from 100% buffer A to 100% buffer B. Error bars reflect the standard deviation across n = 3 injections.

