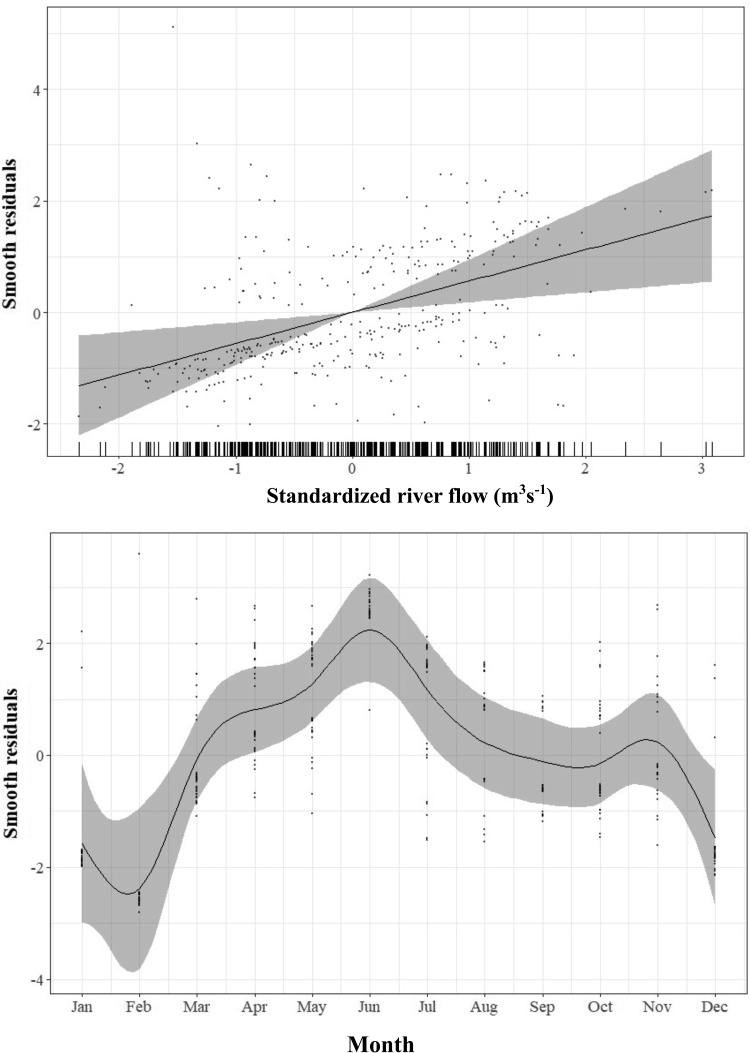
FIG 4.
A generalized additive model estimate of the probability of Campylobacter spp. in the water samples at different river flow rates (top panel) and in 12 months (bottom panel). The rugs on the x axis in the top panel indicate the individual data points. The line shows the fitted model: gray shading represents the 95% confidence intervals, and dots are the residuals.

