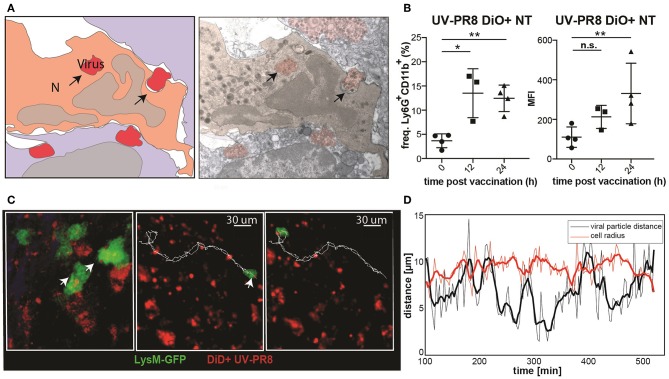
Figure 3.
Neutrophils phagocyte and transport influenza virus. (A) Schematic drawing (left) of an electron micrograph (right) showing neutrophils in the SCS phagocytizing UV-inactivated influenza virus at 2 h p.v.. (B) Flow cytometric analysis indicating the percentage of neutrophils positive for influenza vaccine (DiO labeled, left) and the corresponding MFI analysis (right). (C) Intravital 2-photon micrograph showing a LysM-GFP neutrophil (green) phagocytizing DiD labeled UV-PR8 (red) (left). Intravital 2-photon timelapse showing the correlation between the tracks from a UVPR8-positive vesicle and the neutrophil (right). (D) Distance of the viral particles from the cell centroid (black line), compared to the cell radius (red line). Results are given as mean ± SD. ns p > 0.05; *p < 0.05; **p < 0.01.

