Figure 4.
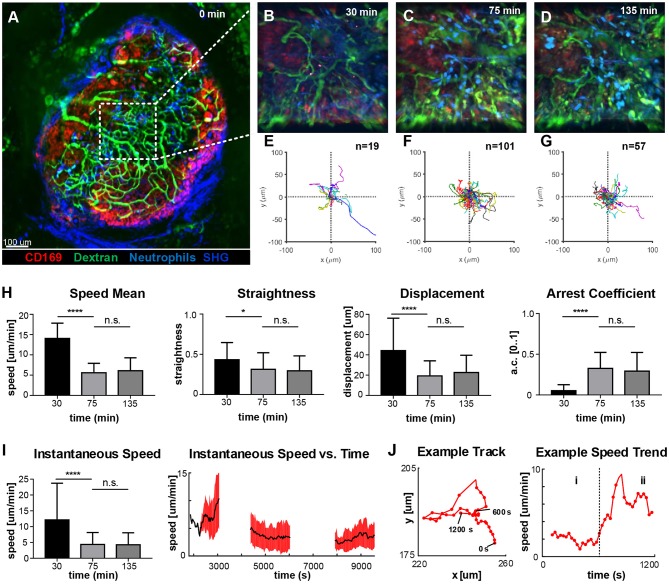
Time-course of neutrophil motility. (A). Low-magnification 2P-IVM micrograph showing the structure of the PLN including vascular network (Fluorescein isothiocyanate-Dextran), CD169+ macrophages (red), collagen scaffold (Second Harmonic Generation–blue) and neutrophils (light-blue) adoptively transferred from a CK6/ECFP animal. Image was acquired immediately after vaccine injection. (B–D) Snapshots of representative LN areas at different time points. (E–G) Plots of cell tracks with common origin showing four preferential migratory directions at 30 min, more equally distributed directionalities at 75 min and a tendency toward the 1st and 4th quadrants at 135 min. The number of tracks is 19, 101, 57, respectively. (H) Cell motility quantification using tracks mean speed, straightness, displacement, and arrest coefficient. (I) Boxplots of Instantaneous speed (left) exhibiting high variance at early time points. Instantaneous speed time series (right) showing distinct trends at different time points. (J) Representative track (left) acquired at 135 min and the associated time series of the instantaneous speed (right). The same cell exhibits two different trends characterized by low speed (i) and high speed (ii). Results are given as mean ± SD. ns p > 0.05; *p < 0.05; ***p < 0.001; ****p < 0.0001.

