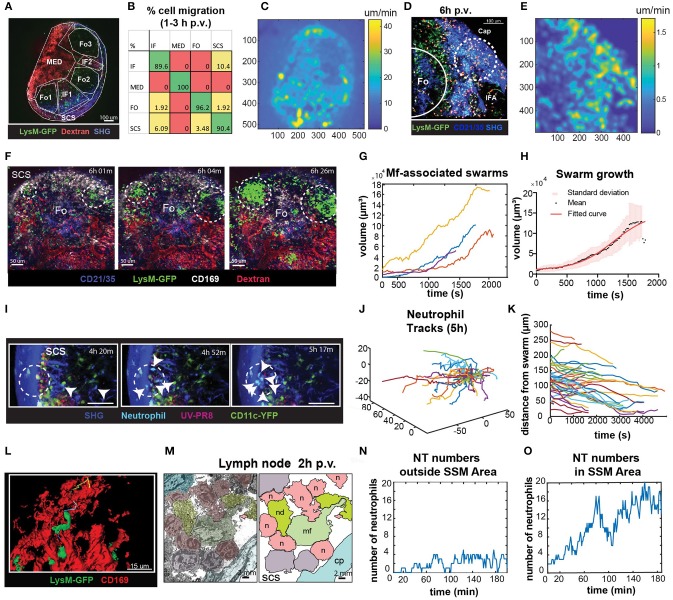
Figure 6.
Characterization of neutrophils swarm formation in the PLN after influenza vaccination. (A) Low magnification 2P-IVM micrograph showing the PLN of a LysM-GFP animal at 3 h p.v. Seven different areas are identified according to their anatomical structure and cell populations: SCS, follicles (Fo1-3), interfollicular areas (IF1-2), and medullary area (MED). (B) Transition matrix showing the migration of cells across different areas. The value at the i-th row and j-th column refers to the percentage of cells that migrated from the i-th to the j-th area. Values on the diagonal refer to the percentage of cells that remained in the same area. (C) Pixel velocity heatmap, showing hotspots with high motility. (D) 2P-IVM micrograph showing the IF and SCS areas at 6 h p.v. Cap refers to the collagen capsule. Dashed lines indicate hotspots toward which cells migrate with high motility. (E) Pixel velocity heatmap showing hotspots with high motility (yellow) (E). Dashed lines indicate hotspots toward which cells migrate with high motility. (F) Sequence of micrographs at 6 h p.v. showing the formation of multiple LysM-GFP neutrophils swarms in the SCS in close proximity to CD169+ macrophages (white) (G) Swarm volumes over time observed at 6 h p.v.. Volumetric data built according to fluorescence intensity thresholding. (H) Sigmoid fit to previous swarm volume (R = 0.652) showing their averaged growth phase. (I) Sequence of micrographs with 25x magnification in the SCS showing CFP-expressing neutrophils initiating a swarm at 5 h p.v. (J) Trajectories of 5 h p.v. swarm plotted from the same origin (K) Time-course distances from the swarm center at 5 h p.v. (L) High magnification 3D reconstruction of LysM-GFP neutrophils interacting with CD169 macrophage network (red) in the SCS region. (M) Colored transmission electron micrograph (left) and schematic drawing (right) showing the interaction of different neutrophils (n) with a macrophage (mf) in the SCS of the LN at 2 h p.v.. (N,O) Number of neutrophils vs. time showing an oscillatory trend in an area without macrophages (N), and an increasing trend indicative of swarming in an area associated with macrophages (O).

