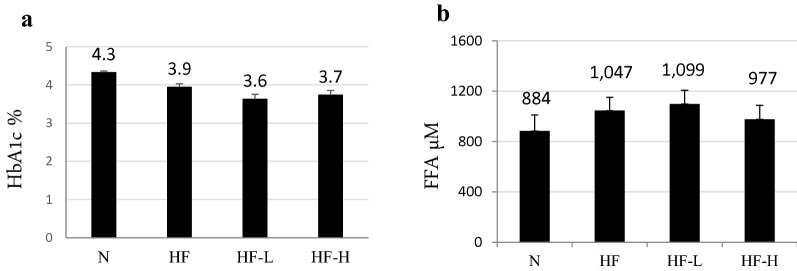
Fig. 4.
a Serum HbA1c and FFA levels in each group. No significant difference was observed among all HF groups, although HbA1c tended to decrease in HF and decrease further in the HF-L and HF-H groups. b The serum FFA concentration was more upregulated in the HF group than that in the N group, but it tended to decrease in the HF-H group despite more severe cardiac dysfunction, although it was not statistically significant. FFA free fatty acid

