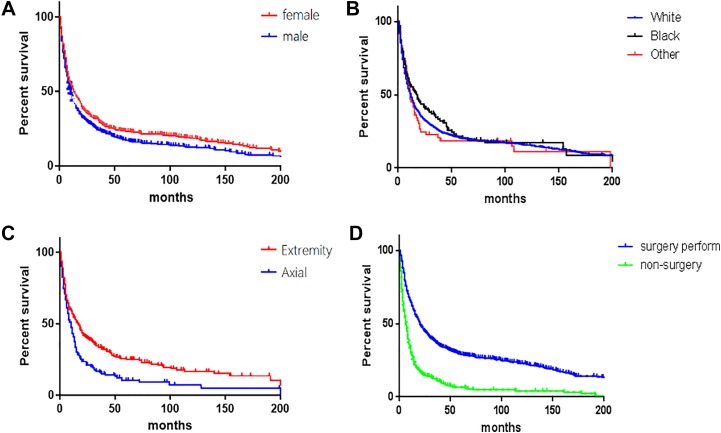
Figure 3.
Kaplan-Meier estimated overall survival in patients with osteosarcoma older than 60 years, stratified by (A) gender (female vs male; P < .01), (B) race (white vs black vs other; P = .39), (C) primary site (vertebral column vs sacrum/pelvis; P < .01), and (D) therapy method (nonsurgery vs surgery perform; P < .01). The log-rank test results have been added in KM plot; the colors of the figures have been changed instead of red and light green.

