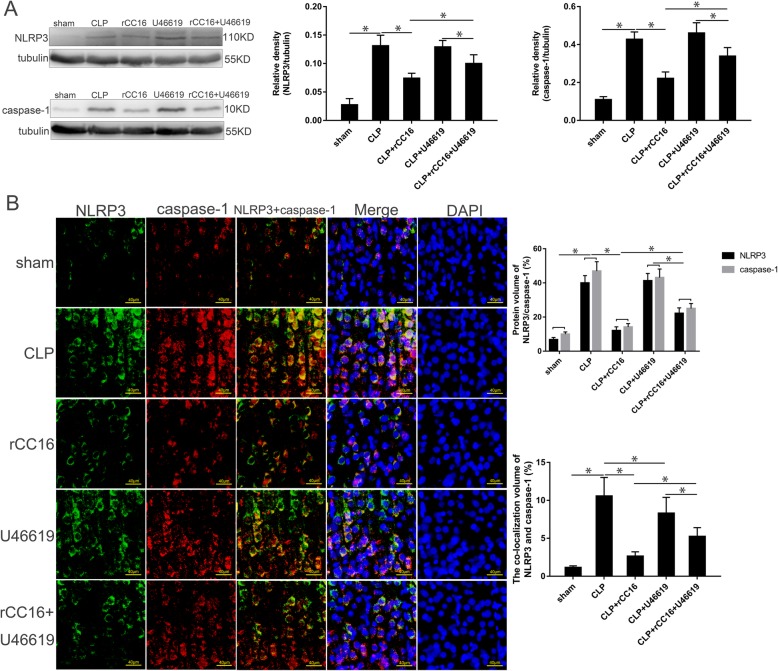
Fig. 7.
The expression of NLRP3 and caspase-1 in the cortex at 12 h. a NLRP3 and caspase-1 in the cortex harvested in different groups. The protein levels were normalized to those of tubulin protein and are shown as relative arbitrary units. b Fluorescence of NLRP3 and caspase-1 in the cortex in different groups. Three-color staining for anti-NLRP3 (green), anti-caspase-1 (red), and nucleus (blue), the protein volume and coincidence rate are represented by histograms. Scale bar = 40 μm. Values are expressed as mean ± SEM (n = 6 in each group; *P < 0.05)

