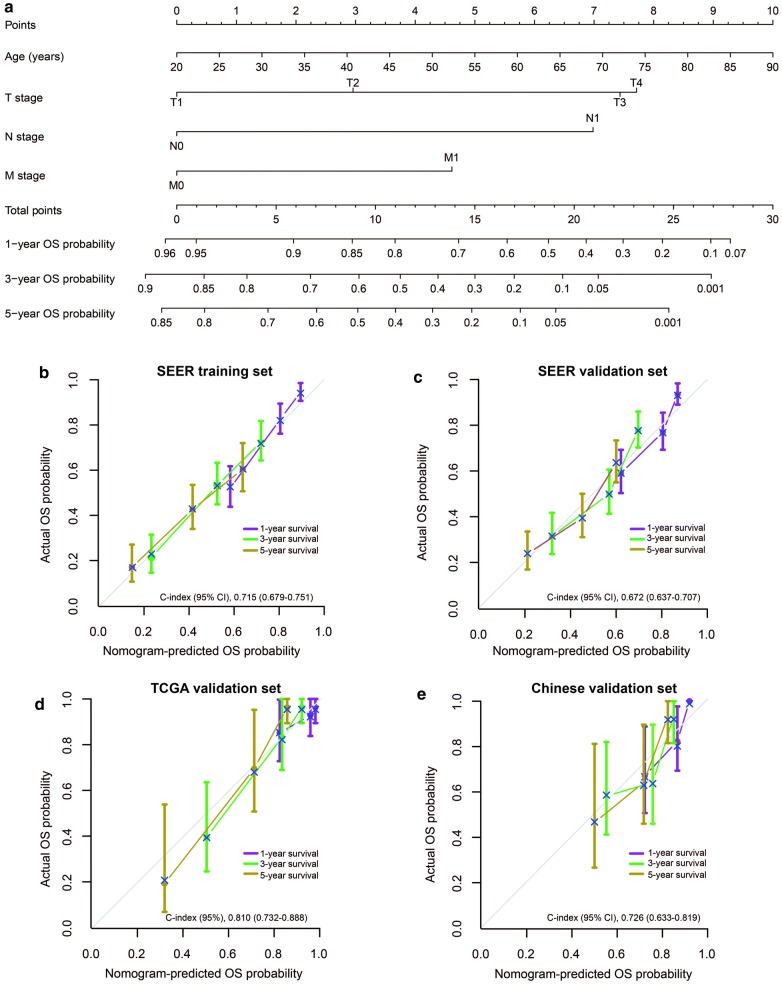
Fig. 2.
The formulated nomogram and its calibration plots. a This nomogram enables the prognostication of the 1-, 3- and 5-year estimates of the OS of ACC patients after surgery. Calibration plots of the nomogram performed in the b SEER training, c SEER internal validation, d the TCGA validation and e the Chinese multicenter validation set, respectively. Nomogram-predicted OS is plotted on the x-axis; actual OS is plotted on the y-axis. Dots represent nomogram-predicted probabilities. An ideal prediction would correspond to the diagonal 45° gray line slope of b–e. The score range of the nomogram is 0 to 29.3. OS overall survival, ACC adrenocortical carcinoma, SEER the Surveillance Epidemiology, and End Results database, TCGA the Cancer Genome Atlas set

