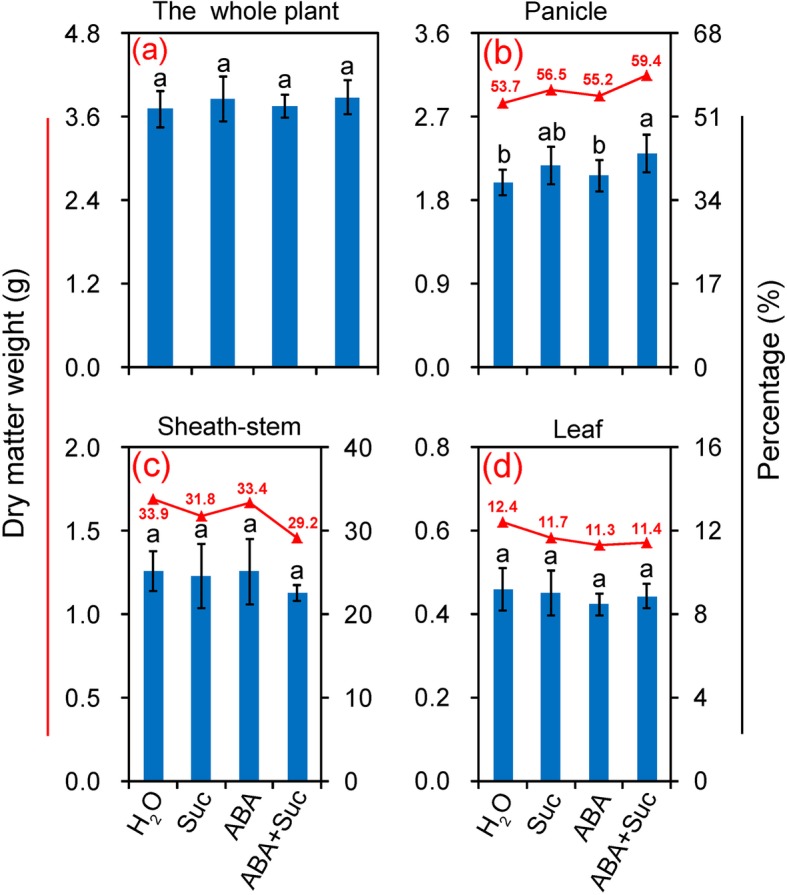
Fig. 3.

Dry matter accumulation and allocation in leaves, sheath-stems, and grains of rice under the sucrose, abscisic acid (ABA), and ABA plus sucrose treatments. The percentage represents the ratio of dry matter weight of panicles, sheath-stems or leaves to the whole plant. Vertical bars denote standard deviations (n = 3). Different letters indicate significant differences between chemical treatments (P < 0.05)
