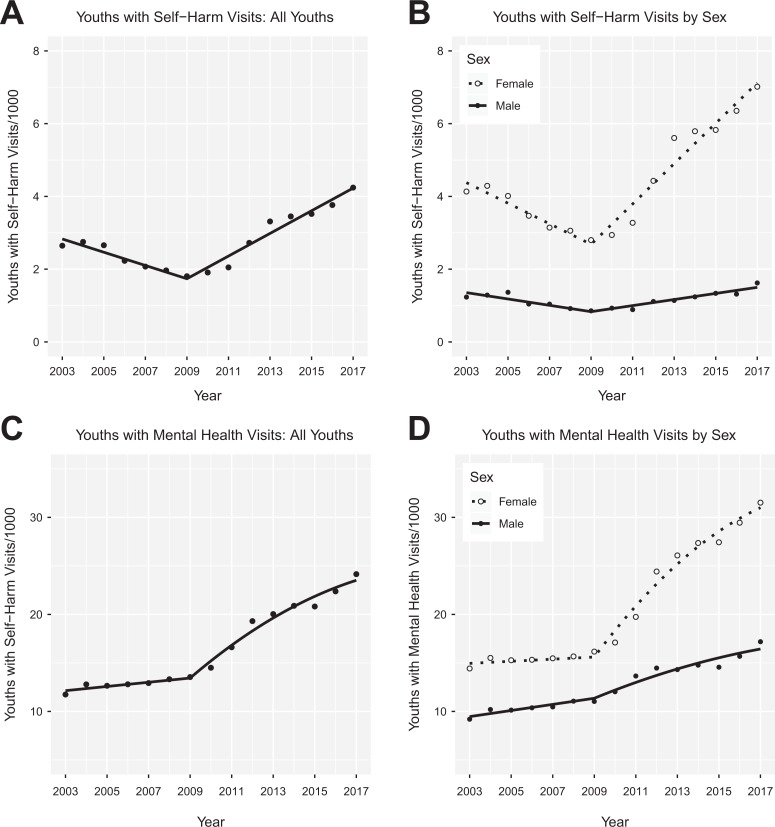
Figure 1.
Rates of adolescents with self-harm emergency department (ED) visits: 2003 to 2017. (A) Rates of adolescents having a self-harm ED visit, per thousand adolescents in the population, as a function of time. The fitted lines are from the discontinuity regression reported in the “All Youths” columns of Table 3. (B) Rates of adolescents having a self-harm ED visit by sex. The fitted lines are from the regression reported in the “By Sex” columns of Table 3. (C) Rates of adolescents having a mental health ED visit. The fitted lines are from the regression reported in the “All Youths” columns of Table 4. A quadratic term is included in the regression model for mental health visits for year ≥2009. (D) Rates of adolescents having a self-harm ED visit by sex. The fitted lines are from the regression reported in the “By Sex” columns of Table 4.

