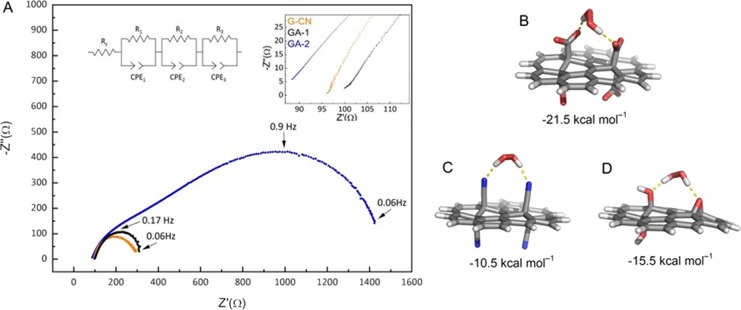
Figure 4.
(A) Nyquist plots obtained for G-CN (orange line), GA1 (black line), and GA2 (blue line) using a rotating disk electrode in an Ar-saturated PBS 0.1 M (pH = 7) electrolyte with 25 mmol of H2O2 at −0.4 V vs SCE; the left inset shows the equivalent circuit used for fitting where Rs is the solution resistance, and the subsequent (resistor, constant phase element, CPE) components are associated with the charge-transfer resistance in parallel with the double layer capacitance (R1, CPE1) and the resistance related to diffusion processes (R2, CPE2 and R3, CPE3). The right inset shows a magnification of the high frequency part of the Nyquist plot where the charge-transfer processes take place. (B–D) Optimized structures of complexes of graphene derivatives (in water) (B, GA; C, G-CN; and D, GO) with H2O2. The hydrogen bonds between H2O2 and graphene functional groups are indicated by yellow dashed lines. The interaction energies in kcal mol–1 between H2O2 and graphene derivatives are stated below each structure.

