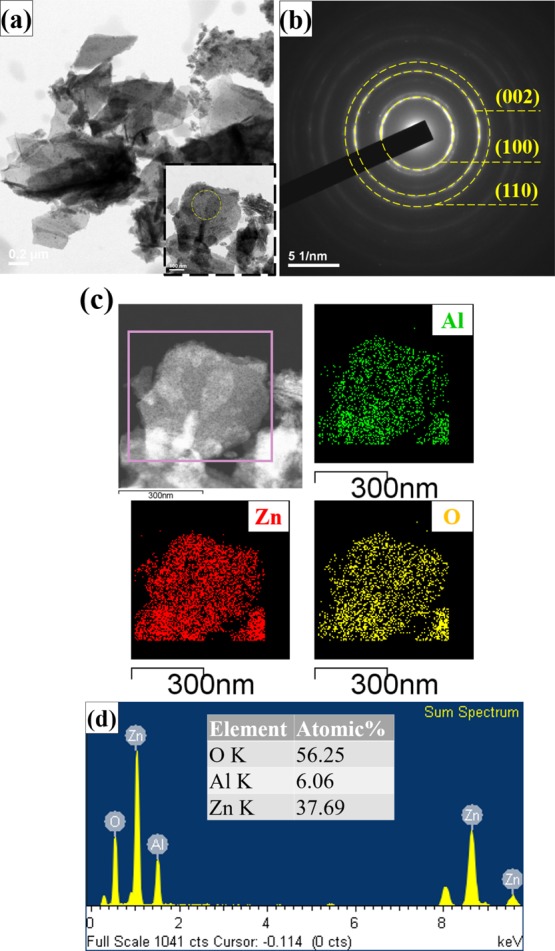
Figure 3.

HR-TEM micrographs of (a) fragments of Al-doped ZnO NSs scraped from the sample (inset: high-resolution micrographs), (b) SAED pattern of Al-doped ZnO NSs, (c) elemental mapping for the selected region, revealing the presence of zinc (red), oxygen (yellow), and aluminum (green), and (d) EDX spectra of Al-doped ZnO NSs.
