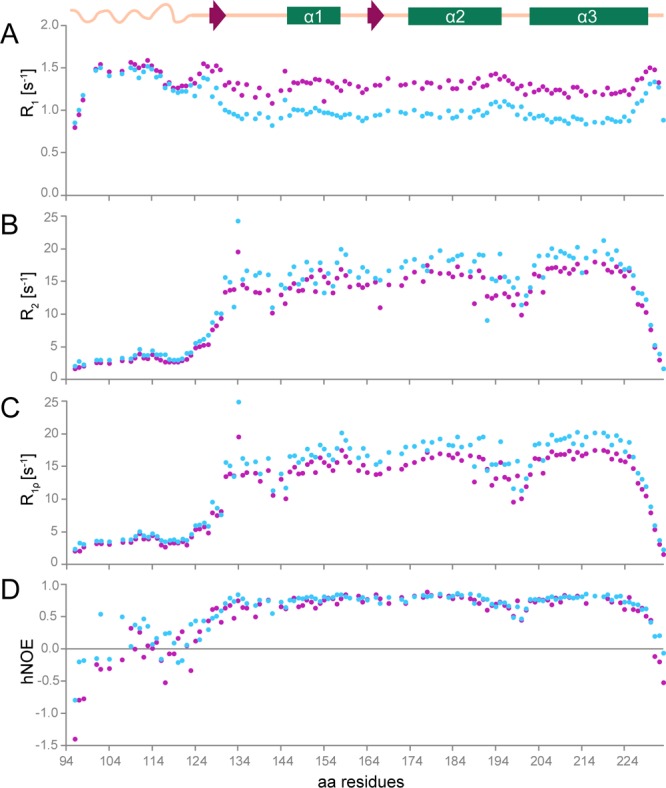
Figure 4.

15N amide backbone relaxation rates and hNOE of mdPrP. (A) 15N longitudinal (R1 = 1/T1), (B) transverse (R2 = 1/T2), (C) spin–lattice relaxation rates in the rotation frame (R1ρ = 1/T1ρ), and (D) hNOE at 298 K at a magnetic field of 14.1 (magenta) and 18.8 T (blue). A schematic presentation of the secondary structure elements of mdPrP is at the top of the figure. For clarity, error bars are not shown here as they are within the size of the data points in the above graphics but are presented in the Supporting Information in Figure S1.
