Figure 2.
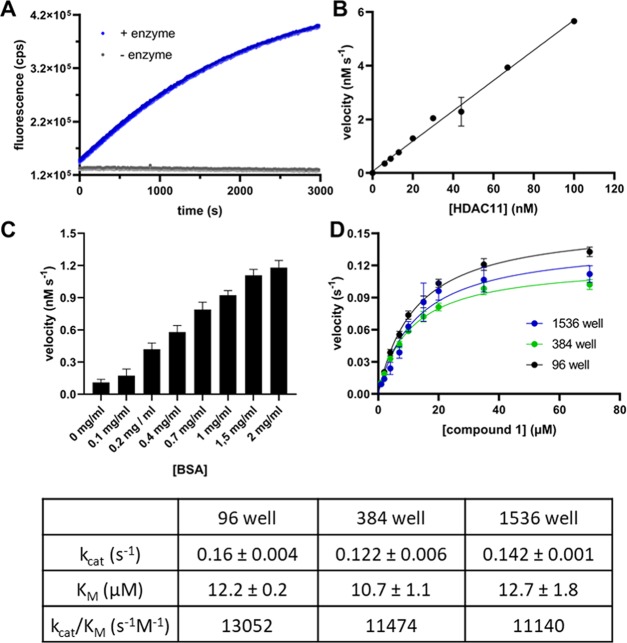
Fluorescence measurements using substrate 1. (A) Fluorescence change as a function of time. The excitation/emission wavelengths were set at 330 ± 75/430 ± 8 nm, respectively. The reaction was performed with the 15 μM substrate and 30 nM HDAC11 (blue dots) as well without enzyme (gray dots). (B) Fluorescence change as a function of the HDAC11 concentration. The reactions were performed with 100, 67, 44, 30, 20, 13, 9, and 6 nM HDAC11 and 50 μM substrate. (C) Velocity of the product formation as a function of BSA concentration in the buffer. The substrate concentration (peptide 1) was 20 μM and HDAC11 concentration was 30 nM. The experiment was performed once with n = 6, and the error bars show the standard deviation (SD). (D) Steady-state kinetics of HDAC11 with compound 1. Reactions were performed using 30 nM HDAC11 and varying concentrations of 1 (0.1–70 μM). The results are from two independent experiments, and each experiment was done with n = 3 (96 well), n = 4 (384 well), and n = 6 (1536 well) replicates, and the error bars show the standard deviation. The velocity v means product formation per time unit and per active site. The resulting kinetic constants of the fit are summarized in the table below.

