Fig. 4.
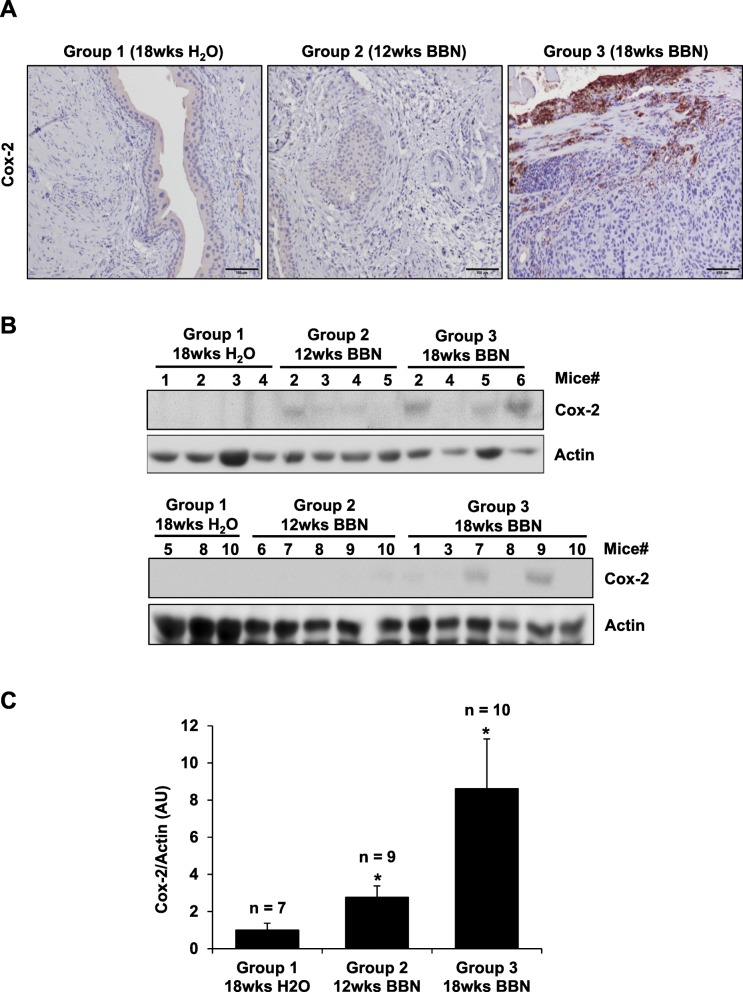
Upregulation of Cox-2 by BBN in bladder carcinoma. The upregulation of Cox-2 in BBN-induced bladder carcinoma was detected by (a) IHC, (b) WB, and (c) densitometry analysis of Cox-2/Actin protein bands from WB analysis using VisionWorks acquisition and analysis software (UVP). Bladder carcinoma in mice from Group 3 – 18wks BBN (n = 10) had 9-fold higher Cox-2 expression when compared to normal urothelium in mice from Group 1 – 18wks H2O (n = 7; control) and 3-fold higher in bladders with hyperplasia/CIS in mice from Group 2 – 12wks BBN (n = 9). Images taken by Leitz DMRB microscope, scale bar 100 μm. Actin was used as a WB loading control. C Data shown mean ± S.E. of the normalized Cox-2/Actin protein bands from WB analysis values of bladder from mice per each group determined by histological validation. Paired Student’s t-test was used to compare the upregulation of Cox-2 expression in BBN-exposed (Group 2 – 12wks BBN and Group 3 – 18wks BBN) with control group (Group 1 – 18wks H2O) (*p < 0.05)

