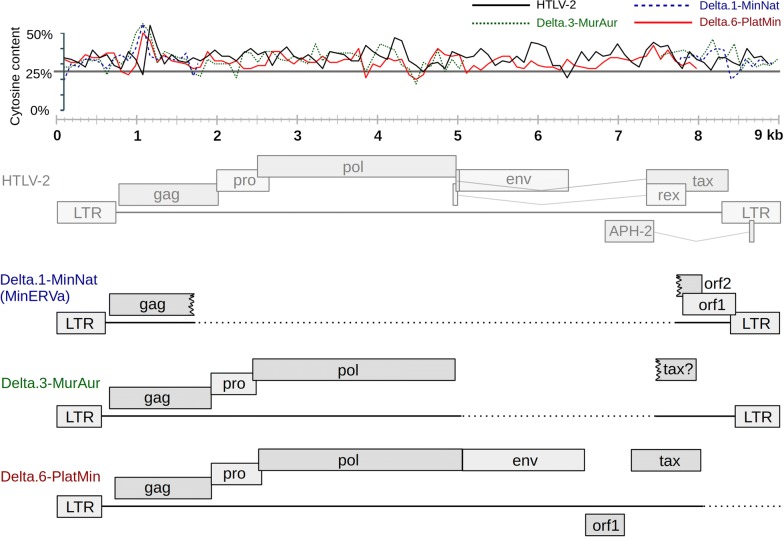
Fig. 1.
Genomic structure of deltaretrovirus-derived ERVs. ERV genomes are shown schematically using boxes to represent retroviral genes and lines to represent nucleotide sequences. Genes below the lines are in antisense orientation (APH-2 in HTLV-2 and orf1 in Delta.6). Dashed lines represent deleted regions. HTLV-2 genome is used as a reference structure. The plot at the top of the figure shows cytosine content within each genome. This was performed by counting average cytosine content in 100nt windows that overlapped by 10nt

