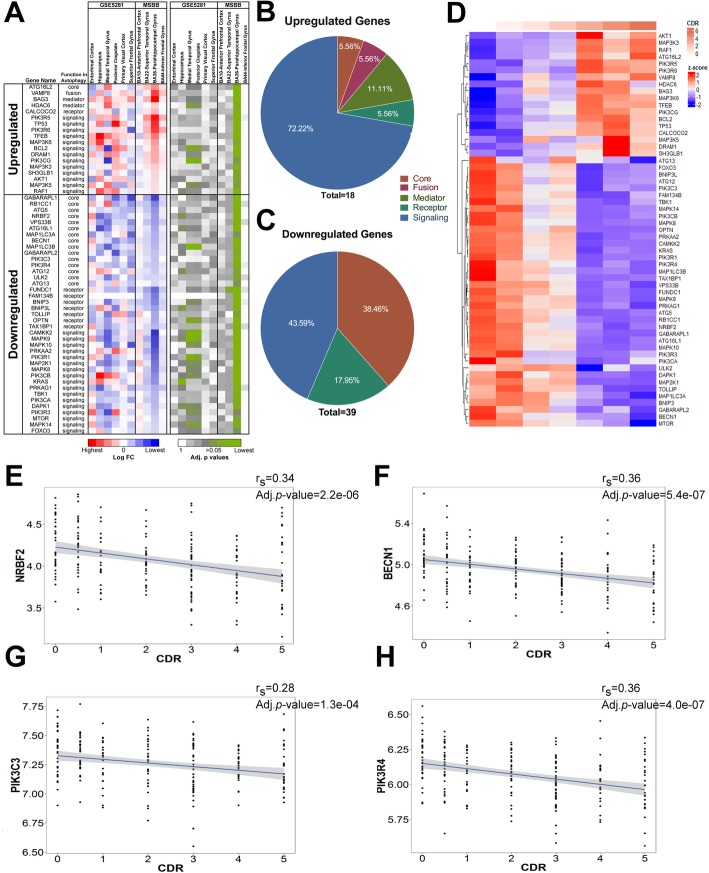
Fig. 1.
ATGs expression is altered in PHG and hippocampus of AD postmortem brains. a Heatmap of the Log FC and adjusted p values of the significantly up- and down-regulated ATG expressions found in PHG (BA36) and their counterpart expression in GSE5281 and other MSBB datasets. b-c Pie charts representing the autophagy gene functions associated to the upregulated or downregulated ATGs identified in (a). d Heatmap representing the mean z-score expression of each significant ATGs at different CDR stages within the PHG (MSBB-BA36). e-h NRBF2, BECN1, PIK3C3 and PIK3R4 gene expressions are progressively reduced in the PHG as a function of CDR score

