Fig. 5.
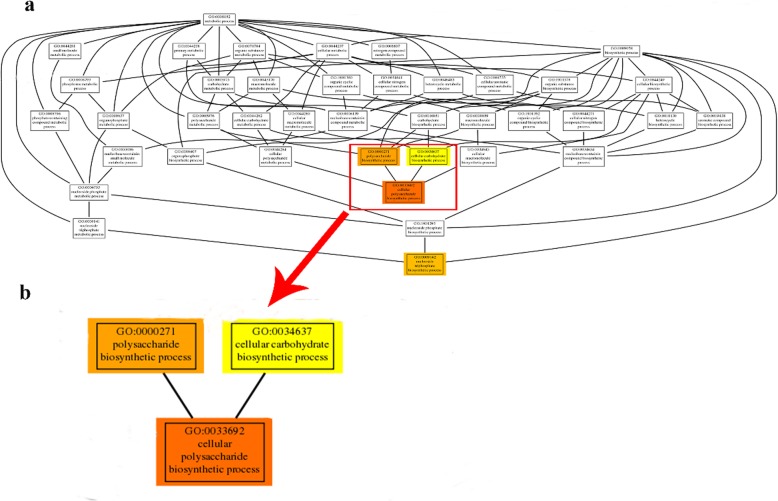
Thumbnails view of directed acyclic graph (DAG) on Molecular function between Dm_R vs. Dm_S. a Thumbnails view of DAGs on MF. The depth of the color represents the degree of enrichment, the deeper the color represents the higher the degree of enrichment. The node horizontal position means the depth of GO terms. b Information of three top enriched terms

