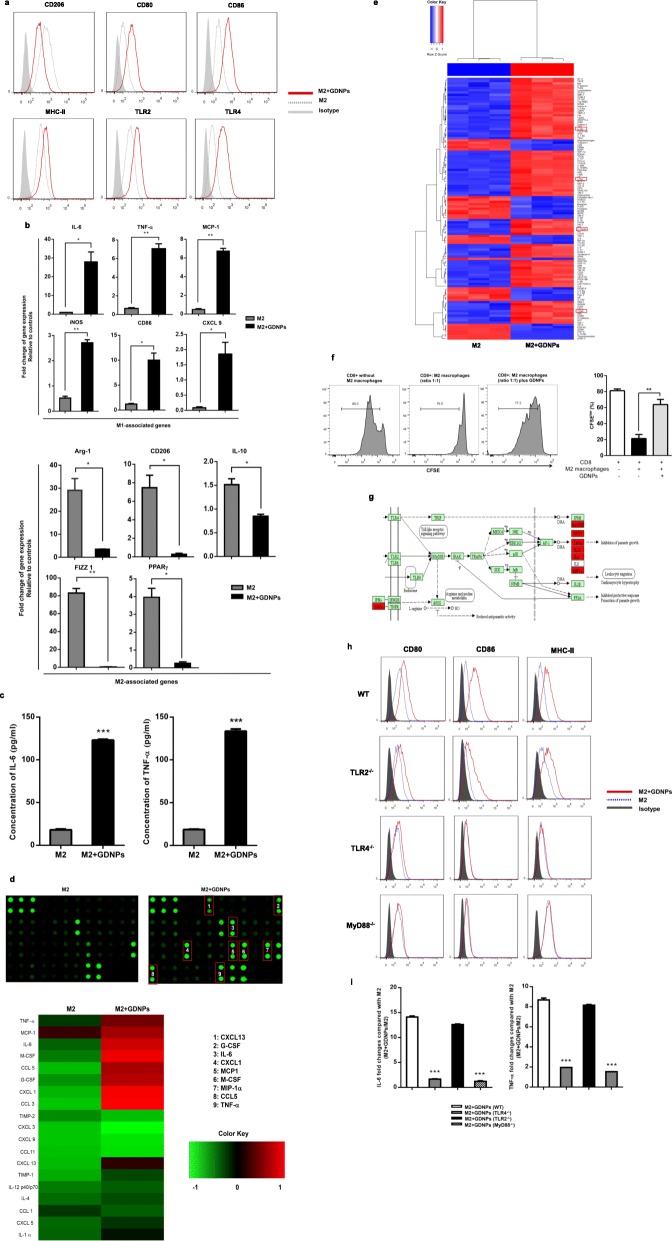
Fig. 3.
GDNPs inhibit M2-like polarization of macrophages. BMDM macrophages were M2 polarized in vitro by treatment with 20 ng/ml IL-4 and 20 ng/ml IL-13 for 2 days. a Representative flow cytometry data showing the surface marker expression profile of M2 macrophages treated with or without GDNPs (10 μg/ml) for 48 h. The shadowed area represents isotype staining. b Quantitative RT-PCR was carried out to assess mRNA expression of M1-marker genes and M2-marker genes. c IL-6 and TNF-α in the supernatants were analysed by ELISAs. d Heat map analysis of inflammatory cytokines from murine M2 macrophages in the presence or absence of GDNPs. e Heat map analysis of inflammatory cytokines from human M2 macrophages in the presence or absence of GDNPs. f In vitro suppressive activity of M2 macrophages treatment with GDNPs or PBS. Representative histograms of CD8+ T cell proliferation at a ratio of 1:1 CD8+ to M2 cells (left panel) and quantification of CD8+ T cell proliferation using CFSE dilution (right panel). g Signalling pathway analysis based on cytokine array examination (high expression of cytokines from murine M2-like macrophages with GDNPs treatment are marked with red). h M2-like macrophages were prepared from wild-type (WT), TLR2−/−, TLR4−/− or MyD88−/− mice and cultured with or without GDNPs (10 μg/ml) for 48 h. The expression of surface markers on macrophages was analysed by flow cytometry. The shadowed area represents isotype staining. i IL-6 and TNF-α were measured in the supernatants by ELISAs. The results represent three independent experiments as the mean ± SEM. *P < 0.05, **P < 0.01, ***P < 0.001 compared with M2 (b, c, f) or M2 + GDNPs (WT) (i); evaluated using Student’s t test

