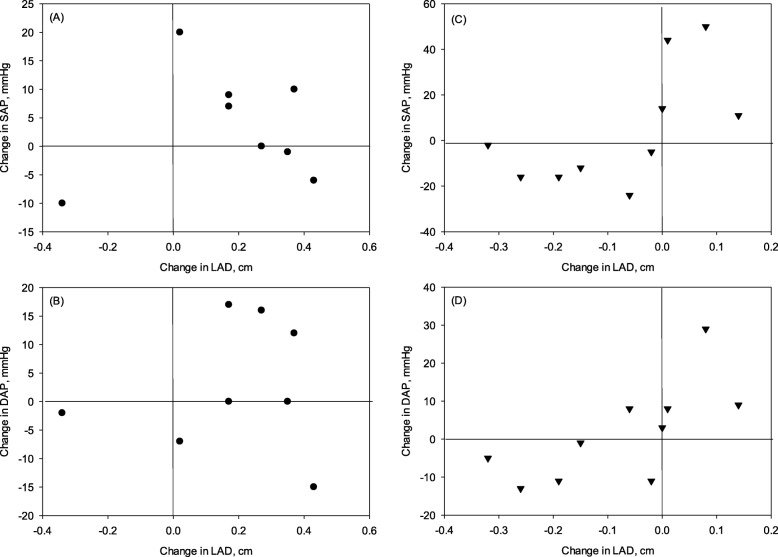
Fig. 5.
Correlation between changes in left arterial diameter (LAD) and blood pressure. Graphs show correlation between change in LAD and change in systolic arterial pressure (SAP) or diastolic arterial pressure (DAP), after 6 months on either (a and B) control (CON) or (C and D) test (CPB) diet. Correlations were significant for both SAP (r = 0.63, P = 0.05) and DAP (r = 0.67, P = 0.035) in CPB dogs, but no correlation was observed in CON dogs (P > 0.75)

