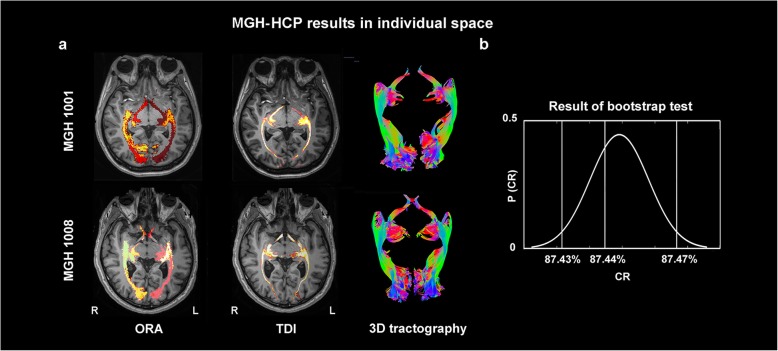
Fig. 3.
Comparison of the ORA-labeled region and TDI region in the MGH-HCP individual space. a Examples of the labeling outcome in participants of round (upper row) and long head-shape (lower row). The distribution of TDI (second column) is overall coincident with the sprawl of the ORA in the participant-specific individual space. 3D tractographies show the fibers that were used to calculate the TDI. b Results of the bootstrap test. This curve shows that the average CR across the 30 MGH-HCP participants was located within the 95% confidence interval, indicating that the congruence between the TDI and the ORA in the MGH-HCP individuals might be representative at the population level

