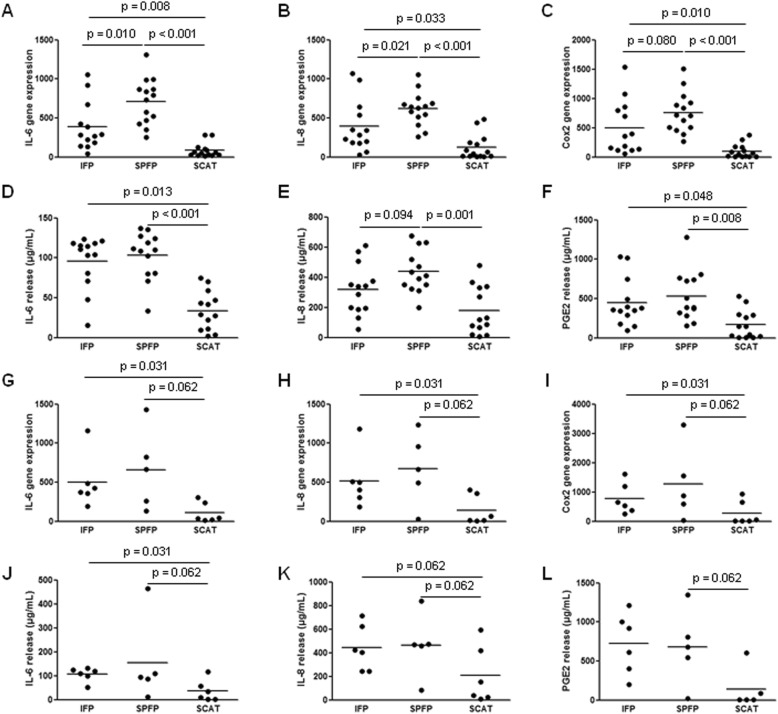
Fig. 5.
Response of preadipocytes and dedifferentiated fat cells to IL-1β stimulation. Preadipocytes (n = 13) (a–f) and DFATc (n = 6) (g–l) isolated from the IFPs and SCATs of OA patients were stimulated by IL-1β (1 ng/mL) before RT-qPCR analysis of the mRNA expression of IL-6 (a, g), IL-8 (b, h), and Cox2 (c, i). The relative mRNA expression was normalized to that of 18S RNA. The IL-6 (d, j), IL-8 (e, k), and PGE2 (f, l) that were released into cell conditioned medium were measured by ELISAs. Bars indicate the mean expression levels

