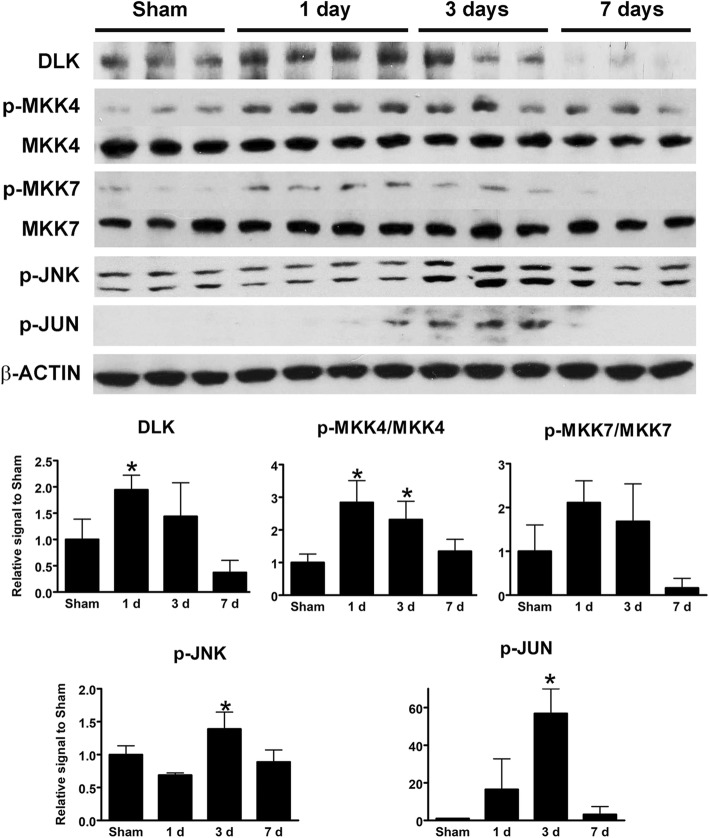
Fig. 7.
Expression of kinases in the DLK-JNK pathway in the retina after IA injury by Western blotting. Bar graphs at the bottom represent quantitation of the intensity of protein bands for DLK, activated MKK4 and MKK7 ratios, p-JNK and p-JUN in the sham condition and at 1, 3, and 7 days post-injury. Data were analyzed with one-way ANOVA followed by Tukey’s post hoc test. * p < 0.05

