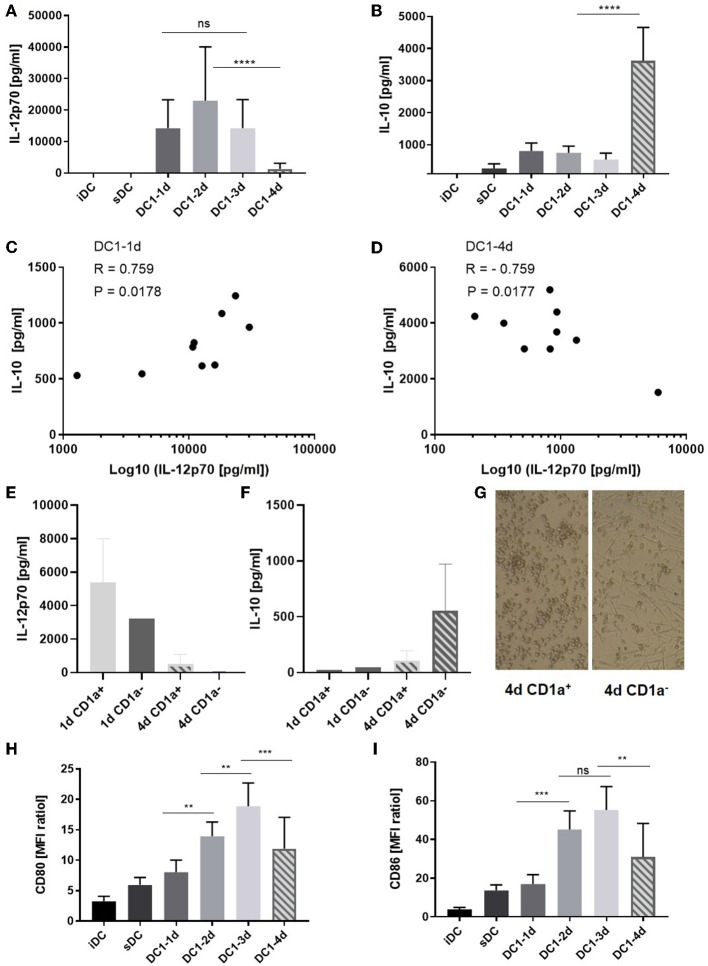
Figure 1.
Cytokine and co-stimulatory receptor alterations during extended maturation of DCs. Immature DCs activated with the DC1 (LPS + IFNγ) cocktail were harvested after 1 (18 h), 2, 3, or 4 days (DC1-1d, DC1-2d, DC1-3d, DC1-4d). Immature DCs (iDCs) and sDCs, stimulated with the gold standard activation cocktail (TNFα + IL-1β + IL-6 + PGE2) for 1 day (18 h), were included for comparison. The concentrations of (A) IL-12p70 and (B) IL-10 were measured in the DC supernatants. Cumulative data are shown from five independent experiments with seven unique donors in total (n = 9). Bars represent mean + standard deviation. The lower limits of detection were 7.8 pg/mL for IL-12p70 and 94 pg/mL for IL-10. Two-way ANOVA with Tukey's post-hoc test was performed on log10-transformed data to compare DC1 groups where ****p ≤ 0.0001, ***p ≤ 0.001, **p ≤ 0.01, and ns, not statistically significant. Pearson's correlation test, where *p ≤ 0.05, was used to test for correlations between the level of IL-12p70 and IL-10 measured in the DC1 supernatants on day 1 (C) and day 4 (D) of maturation. X-axis is shown on a base 10 logarithmic scale. Levels of IL-12p70 (E) and IL-10 (F) is shown from 1- or 4-day activated CD1a+ and CD1a− sorted fractions of iDCs (n = 2) and morphology of each day 4 DC1 subfraction is shown (100X magnification) (G). CD80 (H) and CD86 (I) expression is shown as cumulative data for five-six donors from two-four independent experiments (n = 5–6). Data are presented as MFI ratios (stained sample MFI/unstained sample MFI). Two-way ANOVA with Tukey's post-hoc test was performed on the data to compare DC1 groups where ****p ≤ 0.0001, ***p ≤ 0.001, **p ≤ 0.01, and ns, not statistically significant. Bars represent mean + standard deviation.

