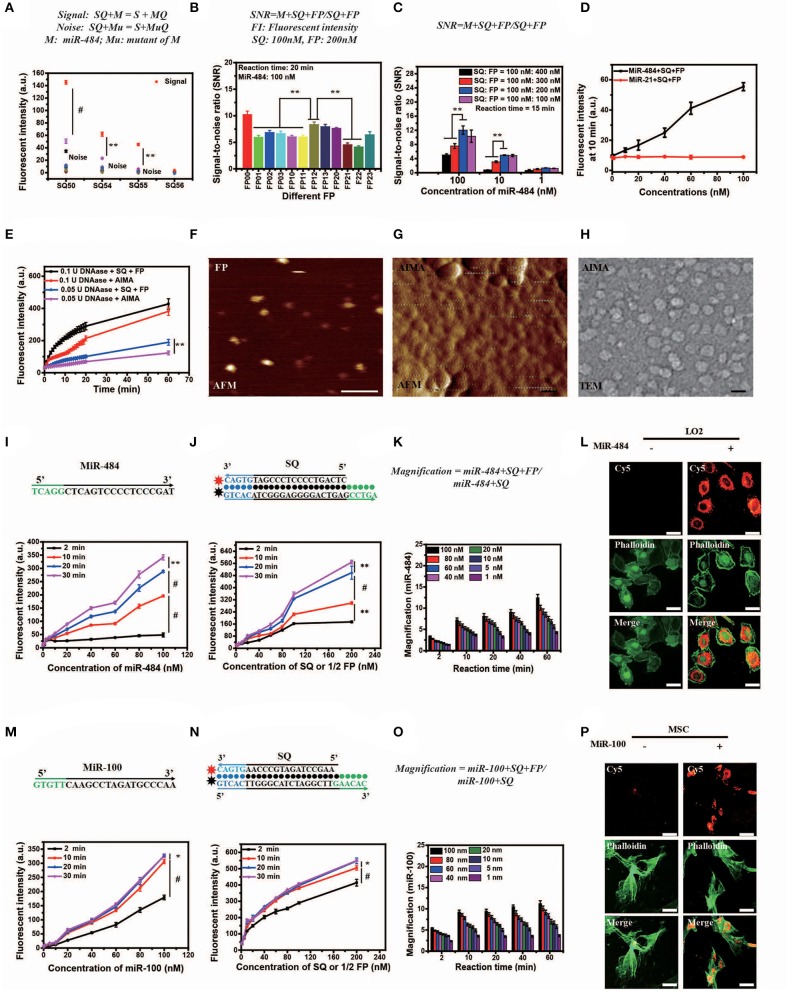
Figure 2.
Optimization, characterization, and in vitro and intracellular dynamics of artificial intelligent signal amplification (AISA) systems with target RNA. (A) Fluorescence intensity generated by different SQs and miR-484 or its 11 mutants measured using a fluorospectrophotometer [signal indicates the fluorescence intensity generated by miR-484, noise indicates the fluorescence intensity generated by its 11 mutants (shown in Table S1)]. (B) Signal/noise ratio (SNR) generated by the reactions based on 12 kinds of double-stranded FP (the fluorescence intensity generated by SQ and FP with miR-484 was considered signal, while fluorescence intensity generated by SQ and FP without miR-484 was considered noise). (C) SNR generated by different ratios of double-stranded SQ/FP and miR-484 at 15 min after reaction (signal and noise are the same as in A). (D) Fluorescence intensity generated by miR-484 and miR-21 (SQ and FP is designed for detection of miR-484). (E) Fluorescence intensity generated by reactions between DNase (0.1 U, 0.05 U) and SQ, FP, or the AISA system. (A–E) Bars represent mean ± SD, n = 5. (F–H) From left to right is the atomic force microscopy (AFM) image of double-stranded FP and the AISA system, the transmission electron microscopy (TEM) image of the AISA system; scale bar, 50 nm. Throughout the paper, ANOVA and the t-test were used to analyze the means, *p < 0.05, **p < 0.01, #p < 0.001. (I) Core sequence of miR-484; fluorescence intensity generated by the reaction between double-stranded SQ (100 nM), FP (200 nM), and different concentrations of miR-484. (J) Sequence of double-stranded SQ for detection of miR-484; fluorescence intensity generated by the reaction between miR-484 (100 nM) and different concentrations of double-stranded SQ and FP (SQ/FP = 1/2). (K) Magnification of the reaction between SQ (100 nM) and different concentrations of miR-484 with and without double-stranded FP. (L) Bright field microscopic image of LO2 cells transfected with or without miR-484. Fluorescence image of LO2 cells transfected with or without miR-484 after adding the AISA system. Fluorescence image of LO2 cells transfected with or without miR-484 stained with fluorescein isothiocyanate (FITC) -phalloidin. Merged image of LO2 cells transfected with or without miR-484. (M) Core sequence of miR-100; fluorescence intensity generated by the reaction between double-stranded SQ (100 nM), FP (200 nM), and different concentrations of miR-100. (N) Sequence of double-stranded SQ for detection of miR-100; fluorescence intensity generated by the reaction between miR-100 (100 nM) and different concentrations of double-stranded SQ and FP (SQ/FP = 1/2). (O) Magnification of the reaction between SQ (100 nM) and different concentrations of miR-100 with and without double-stranded FP. (P) Bright field microscopic image of mesenchymal stem cells (MSC) transfected with or without miR-100. Fluorescence image of MSC transfected with or without miR-100 after adding the AISA system. Fluorescence image of MSC transfected with or without miR-100 stained with FITC-phalloidin. Merged image of MSC transfected with or without miR-100. (I–P) Scale bars, 10 μm (ANOVA and the t-test were used to analyze the means, *p < 0.05, #p < 0.001).

