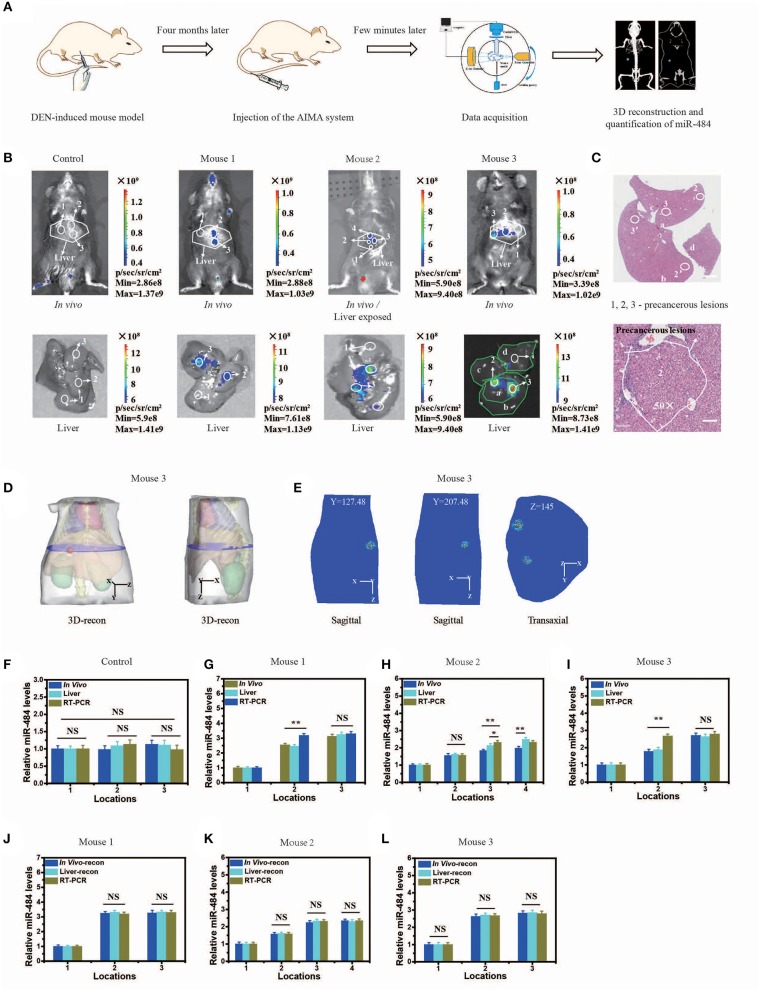
Figure 4.
Visualization and three-dimensional (3D) reconstruction of miRNA in vivo based on diethyl nitrosamine (DEN)-induced mice and the microscopic image of liver slices with hematoxylin and eosin (H&E) staining. (A) Schematic illustration of the quantification of miR-484, including DEN-induced mouse model; injection of the artificial intelligent signal amplification (AISA) system (included SQ and FP); data acquisition; 3D reconstruction and quantification of miR-484. (B) Upper panel: fluorescence images of DEN-induced tumorigenic mice (for 4 months) and phosphate-buffered saline (PBS)-injected mice 15 min after i.v. injection of the AISA484 system (included SQ and FP). Lower panel: fluorescence images of livers from the above DEN-induced mice and PBS-injected mice. (C) Microscopic image of liver slices with H&E staining of the liver of mouse 3. The liver lobes are marked a–d, and the precancerous lesions are marked 2, 3, 2′, and 3′. Scale bars are 120 and 30 μm, respectively. (D) 3D reconstruction results of miR-484 location in mouse 3. (E) Two planes of the reconstructed miRNA location. (F–I) Relative miR-484 levels assessed by surface fluorescence intensity and real-time RT-PCR analysis of samples with a size <40 μm in 4-month-old PBS- or DEN-injected mice (mice 1–3). (J–L) Relative miR-484 levels assessed by reconstructed fluorescence intensity and real-time RT-PCR analysis of samples with a size <40 μm in DEN-injected mice (mice 1–3) (ANOVA and the t-test were used to analyze the means, *p < 0.05; **p < 0.01; NS, no significant difference).

