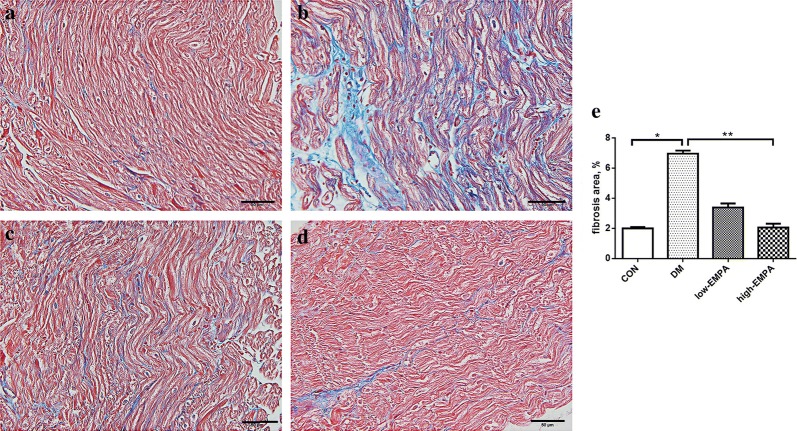
Fig. 3.
Left atrial interstitial fibrosis in the study groups. a Control group; b diabetes mellitus (DM) group; c low-dose empagliflozin group; d high-dose empagliflozin group; e Illustrates the quantitative ratio of the area of fibrosis to the area of the reference area. Each group included 5–8 rats.*Compared with the control group, p < 0.05; **Compared with the DM group, p < 0.05

