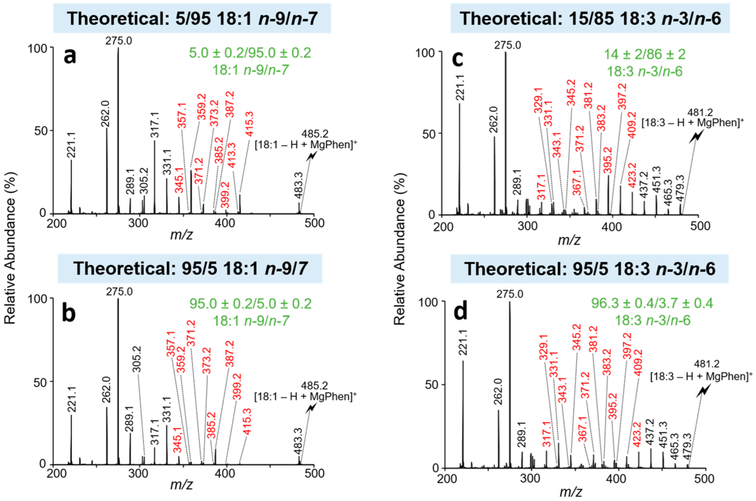
Figure 2.
CID spectra representative of isomeric FA mixtures analyzed as the charge-inverted FA complex cation, [FA – H + MgPhen]+. CID spectra of [18:1 – H + MgPhen]+ for the isomeric mixture of 18:1 n-9/n-7 at the molar ratios of (a) 5/95 and (b) 95/5. CID spectra of [18:3 – H + MgPhen]+ for the isomeric mixture of 18:3 n-3/n-6 at the molar ratios of (c) 15/85 and (d) 95/5. Product ions used for relative quantitation are shown in red. Calculated isomer compositions (mean ± standard deviation, n = 3) are shown in green. The lightning bolt signifies the precursor ion subjected to ion-trap CID.

