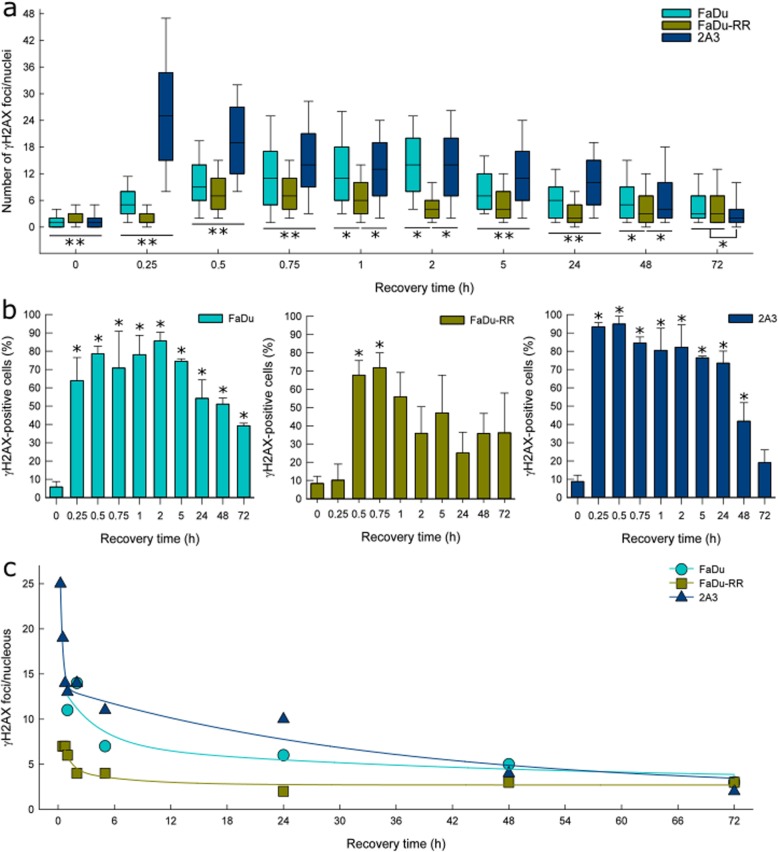
Fig. 4.
γH2AX foci in isogenic FaDu, FaDu-RR and 2A3 cells after 5 Gy irradiation. a A median number of γH2AX foci in isogenic cells determined by γH2AX immunofluorescence at various recovery times after irradiation. Box plots are median values with 25th and 75th percentile with 10th and 90th percentiles as bottom and top whiskers. ** indicates a significant difference in γH2AX foci number between isogenic FaDu, FaDu-RR, and 2A3 cells; * indicates a significant difference in γH2AX foci number. b The fraction of γH2AX-positive isogenic cells at various recovery times after irradiation. Bars are AM ± SEM from three independent experiments. * indicates a significant difference in the fraction of in γH2AX-positive cells compared to control non-irradiated cells. c Kinetics of γH2AX foci resolution in isogenic cells. Experimental data were fitted to a two-phase exponential decay equation. Symbols are the median values of pooled data from three independent experiments

